






TL;DR
- Without a week-0 snapshot of ticket volume, lead time per stage, and developer NPS, every improvement you measure post-launch is unverifiable. Delta measurement requires two data points, and the first one has to exist before the portal goes live.
- Six weeks of environment standardization produces zero movement in deployment frequency, even though the work was worth doing. DORA measures delivery outcomes, not the cognitive-load reduction that precedes them. You need both layers, or the ROI case has a six-month blind spot.
- Track golden-path adoption rate alongside it. Rising deploys with low golden-path usage means developers are shipping around the portal, which defeats the governance argument entirely and weakens every ROI claim you make to finance.
- Convert it to dollars. If a severity-1 incident costs $X per hour and your portal cuts recovery time from four hours to 90 minutes, that avoided cost is auditable. It’s the fastest path from engineering metric to a number finance will accept without a follow-up question.
- A developer who provisions a staging environment without filing a ticket doesn’t move any DORA number. Still, the time saved is real, countable from portal event logs, and converts directly to engineer hours recaptured per week.
- Meaningful DORA deltas take six to twelve months. Daily active users, CLI usage rate, and percentage of teams on golden paths are the numbers that keep the budget intact while you wait for the delivery outcomes to show up in the data.
When Portal Adoption Outpaces Your Ability to Prove Its Value
Six months after go-live, the CFO asks what the portal returned. A simple question that kills more IDP budgets than poor adoption does. DORA’s 2025 research found that 90% of organizations now report using an internal developer platform and 76% have dedicated platform teams, meaning the decision to deploy is largely settled. What still isn’t settled is how to prove delivery. IDPs need a KPI layer that captures both delivery performance and developer experience, or the investment case collapses at renewal.
The obvious shortcut, dropping DORA metrics onto a slide and calling it ROI, breaks in predictable ways. A platform team that spends six weeks standardizing environment variables across 12 squads produces no change in deployment frequency during that period, even though the work was genuinely valuable. DORA measures delivery outcomes; it doesn’t capture the cognitive-load work that precedes faster delivery. The structural reason teams miss this is that they instrument too late and skip establishing a pre-deployment baseline.
Without a week-0 snapshot of lead time, ticket volume, and developer satisfaction scores, delta measurement becomes impossible, and ROI arguments become anecdotes. As one platform engineering lead noted in a practitioner discussion, the teams getting value from DORA track “pain points along the commit-to-deployment path,” not just the four headline numbers.
This article covers three things: how to baseline before the portal launches, how to adapt DORA metrics for portal-specific measurement, and how to translate both into the financial case that survives a budget review.
Baselining Before the Portal Goes Live Matters More Than the Metrics Themselves
Most measurement failures are baseline failures. The three data points below are the ones worth capturing before a single developer logs into the portal.
Ticket Volume and Wait Time as Pre-Deployment Anchors
Platform teams skip the baseline because they’re busy launching. That skipped step makes every downstream metric unverifiable. Ticket volume for repetitive infrastructure requests and average wait time per ticket are the two numbers worth capturing before go-live. Cycloid’s internal developer portal page notes that repetitive tickets account for up to 50% of all tasks in most organizations; that figure is only actionable if you know your org’s actual number before the portal absorbs those requests. Without the anchor, a 30% reduction in ticket volume after six months is a guess.
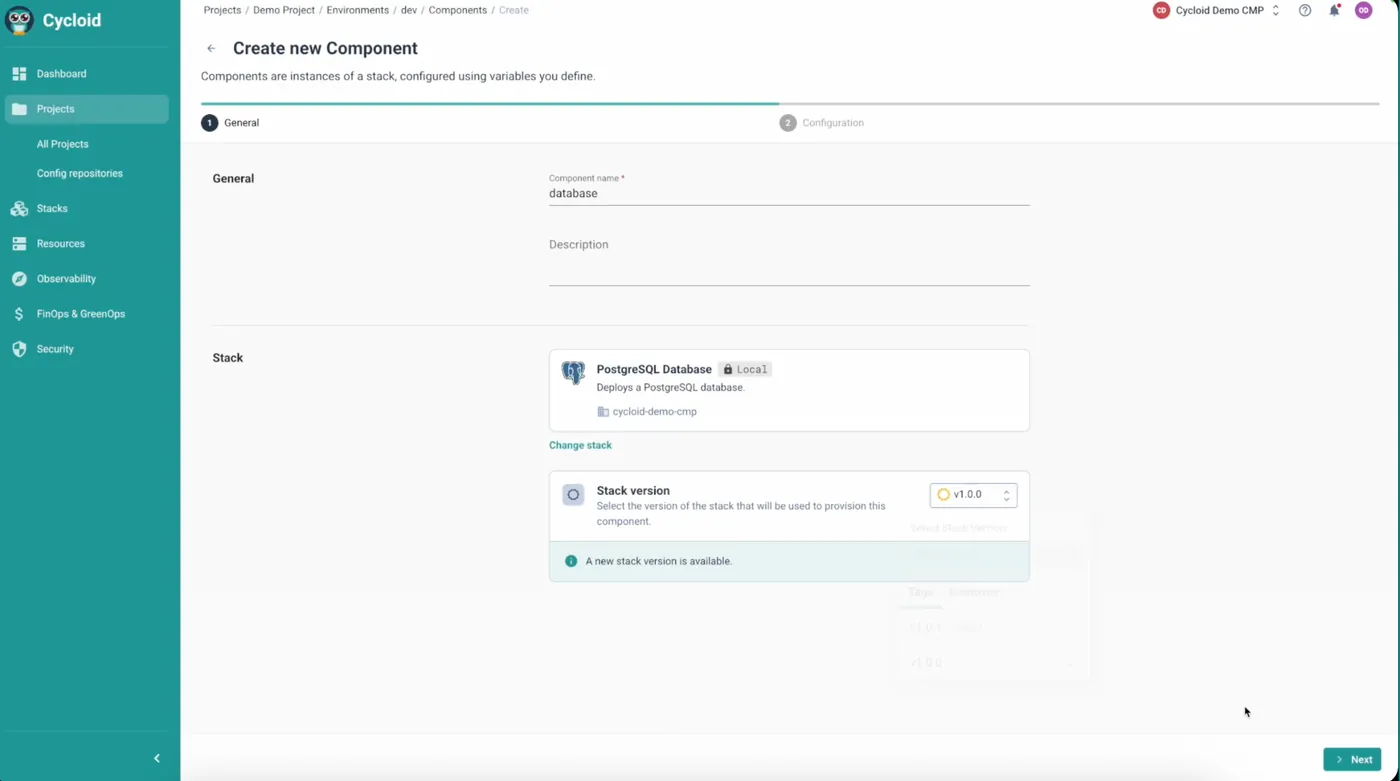
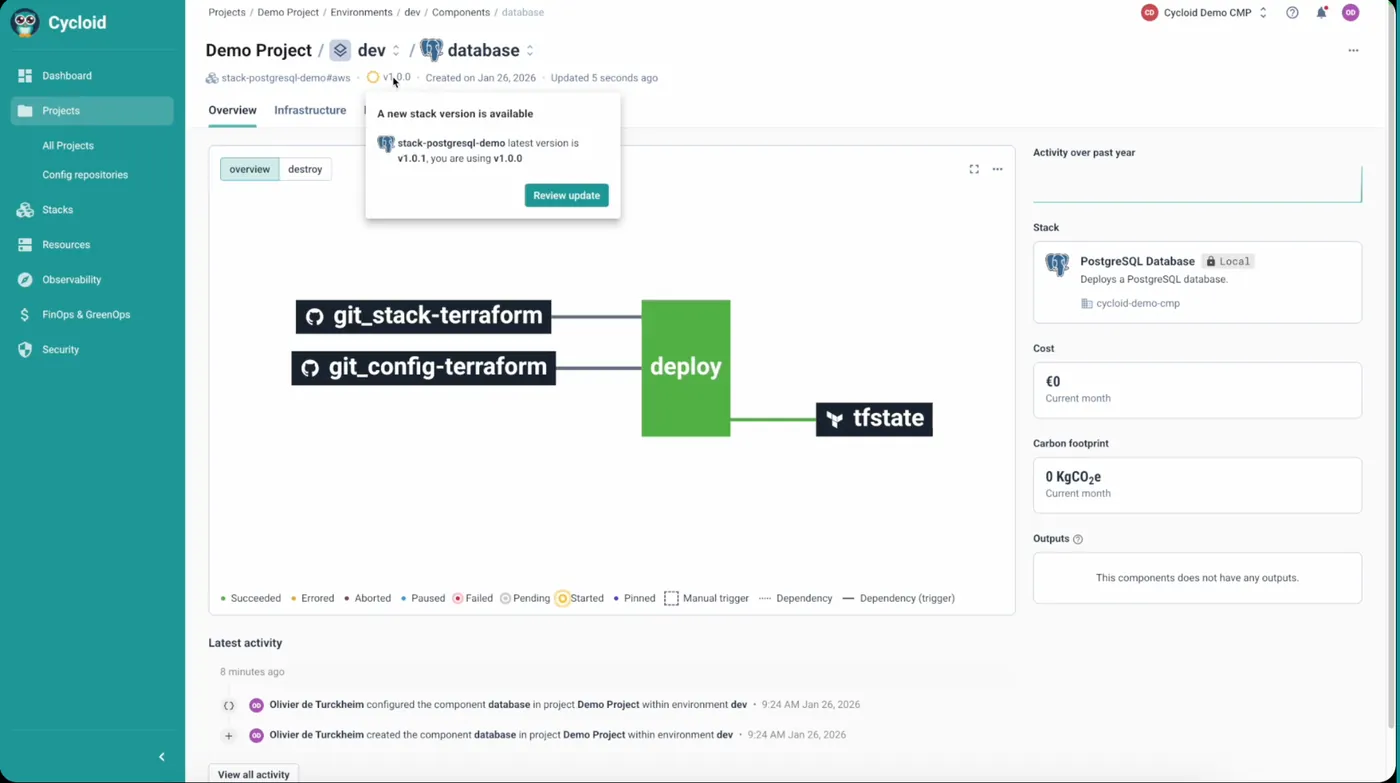
The Cycloid component creation flow puts stack selection, version control, and cost visibility on a single screen. A developer picking a PostgreSQL stack sees the GitOps-backed source, the pinned version, and the deployment pipeline before clicking anything. Every action writes to the audit log, so the platform team gets a timestamped record of who provisioned what and when, which is exactly the event data you need to measure self-service rate against your pre-deployment ticket baseline.
Establishing a Lead Time Baseline Across the Commit-to-Production Path
Lead time for changes measures how long it takes a commit to reach production. Before instrumenting the portal, map where the handoff delays actually live: is the bottleneck in code review, in infrastructure provisioning, or in the approval chain?
Teams that measure lead time end-to-end but skip decomposing it by stage can’t tell whether a portal-driven improvement came from faster provisioning or faster review cycles. Establish the baseline per stage. The improvement signal becomes credible and attributable.
Developer Satisfaction Survey as a Quantitative Starting Point
Developer NPS or a structured CSAT survey tied to specific workflows gives you a quantitative baseline that DORA can’t provide. DORA’s own platform engineering capability framework calls developer satisfaction surveys “vital for connecting platform improvements directly to developer productivity.” One number at week 0 and one number at week 13, with a linked question asking which workflows changed most, produces a signal that holds up under finance scrutiny.
DORA Metrics Adapted for Portal-Specific Measurement
The four DORA metrics weren’t designed with internal portals in mind, which means applying them without modification produces numbers that are technically correct and strategically useless. Each metric below needs a portal-specific lens to tell you something the raw figure can’t.
Deployment Frequency as a Self-Service Adoption Proxy
Deployment frequency measures how often teams successfully release to production. Still, in an IDP context, it also surfaces whether developers are using the portal’s standardized pipelines or running their own scripts. Track golden-path adoption rate alongside deployment frequency: what percentage of deployments go through the portal’s managed CI/CD versus off-road methods.
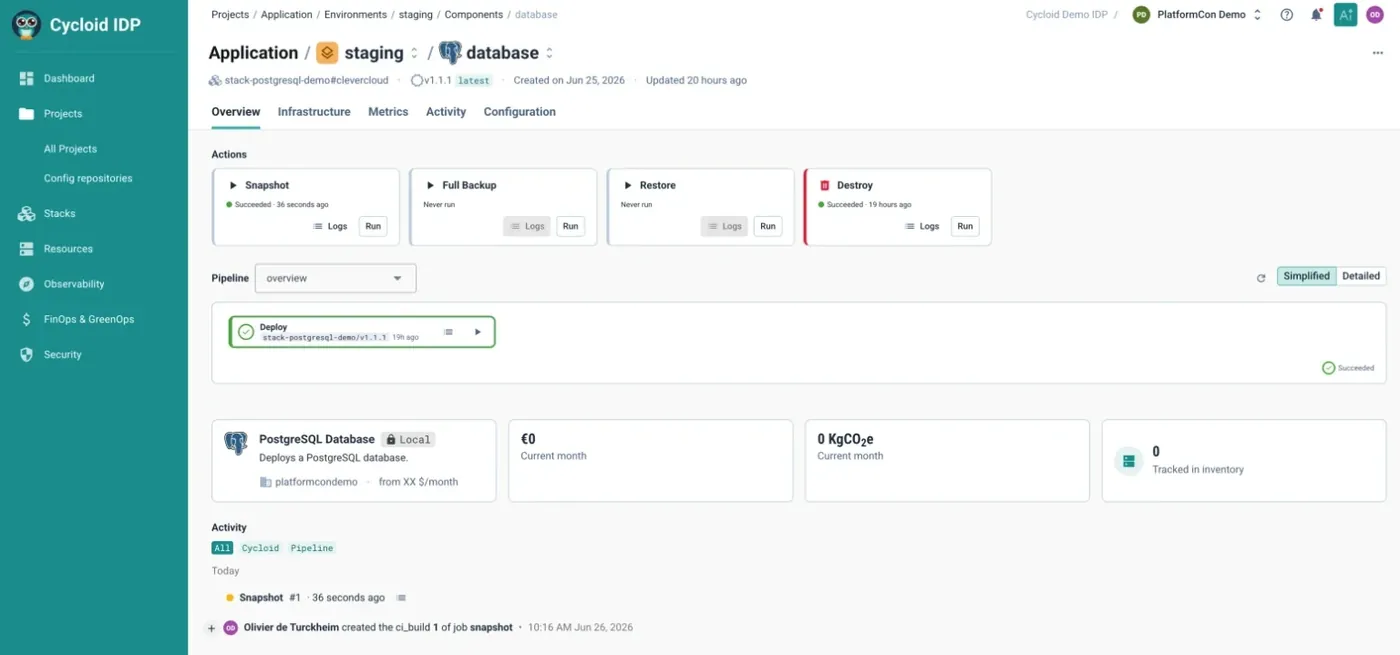
This Cycloid component view shows every deployment action, pipeline run, cost, and carbon figure in one place, tied to the same audit log that tracks golden-path usage. The pipeline status field distinguishes whether a deployment ran through the managed CI/CD path or was triggered manually, which is precisely the signal that separates golden-path adoption from raw deployment frequency. Cost and carbon footprint update per component per environment, so finance and platform teams are looking at the same numbers. That combination of pipeline attribution and cost visibility is what makes golden-path adoption rate a measurable KPI rather than an estimate.
Low golden-path adoption while deployment frequency rises means developers are shipping, but not through the portal, which limits both governance and the ROI argument. Cycloid’s managed CI/CD pipelines centralize pipeline execution, making golden-path adoption rate measurable directly from the platform’s audit logs.
Change Failure Rate as a Portal Quality Signal
Change failure rate (CFR) measures the percentage of deployments that cause production failures. When a portal introduces standardized golden paths with built-in IaC templates and policy-as-code, CFR should fall over time because deployments follow vetted configurations rather than ad-hoc scripts.
Cycloid’s Infrapolicies implement policy-as-code directly in the provisioning workflow, providing a concrete mechanism for reducing failure rate at the source. A rising CFR after portal adoption is the tradeoff worth naming: it often means teams are deploying more frequently without yet internalizing the governance layer.
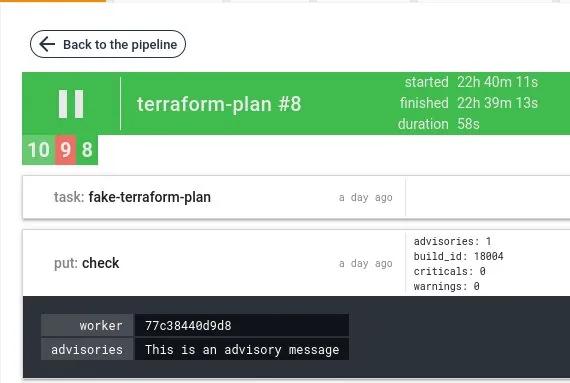
In a pipeline context, a Concourse Resource is available and can be easily plugged right after a terraform plan step and just before a notification mechanism.
Example of output:
Validation with advisories: the job is green, and displays advisory results as metadata:
MTTR as the Incident Cost Input for Financial ROI
Mean time to recover (MTTR) translates directly into incident cost, which is where the ROI calculation becomes legible to finance. If a severity-1 incident costs $X per hour in engineer time and customer impact, and the portal’s observability layer reduces MTTR from four hours to 90 minutes, the avoided cost per incident is calculable and auditable.
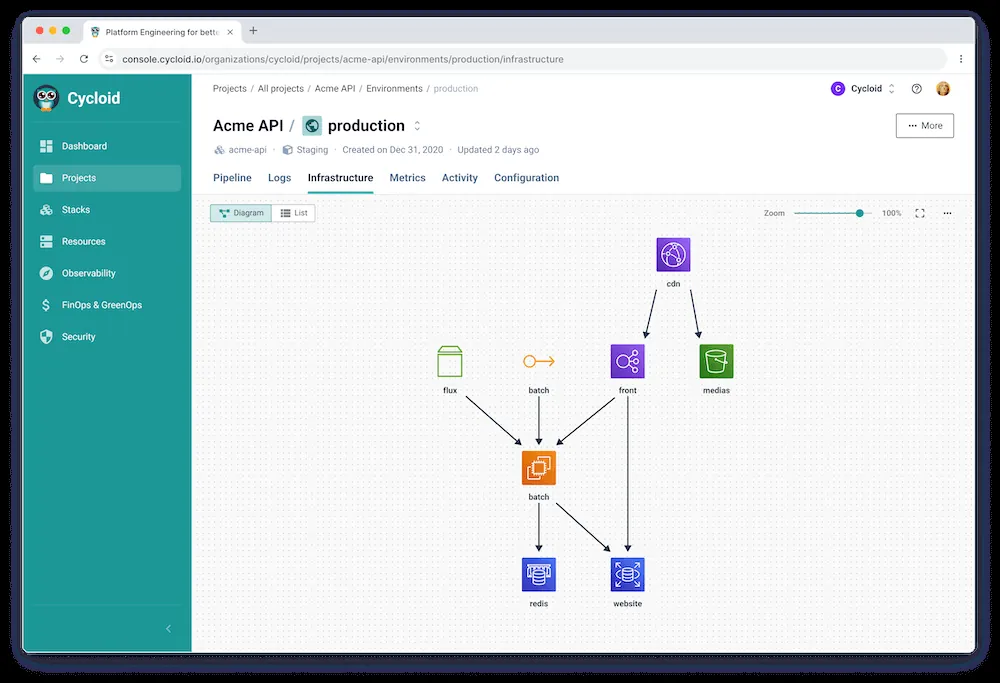
Cycloid’s Asset Inventory and InfraView provide infrastructure diagrams tied to live state, shortening the time engineers spend tracing incident scope. That’s a specific mechanism, not a general claim, and it belongs in the ROI model.
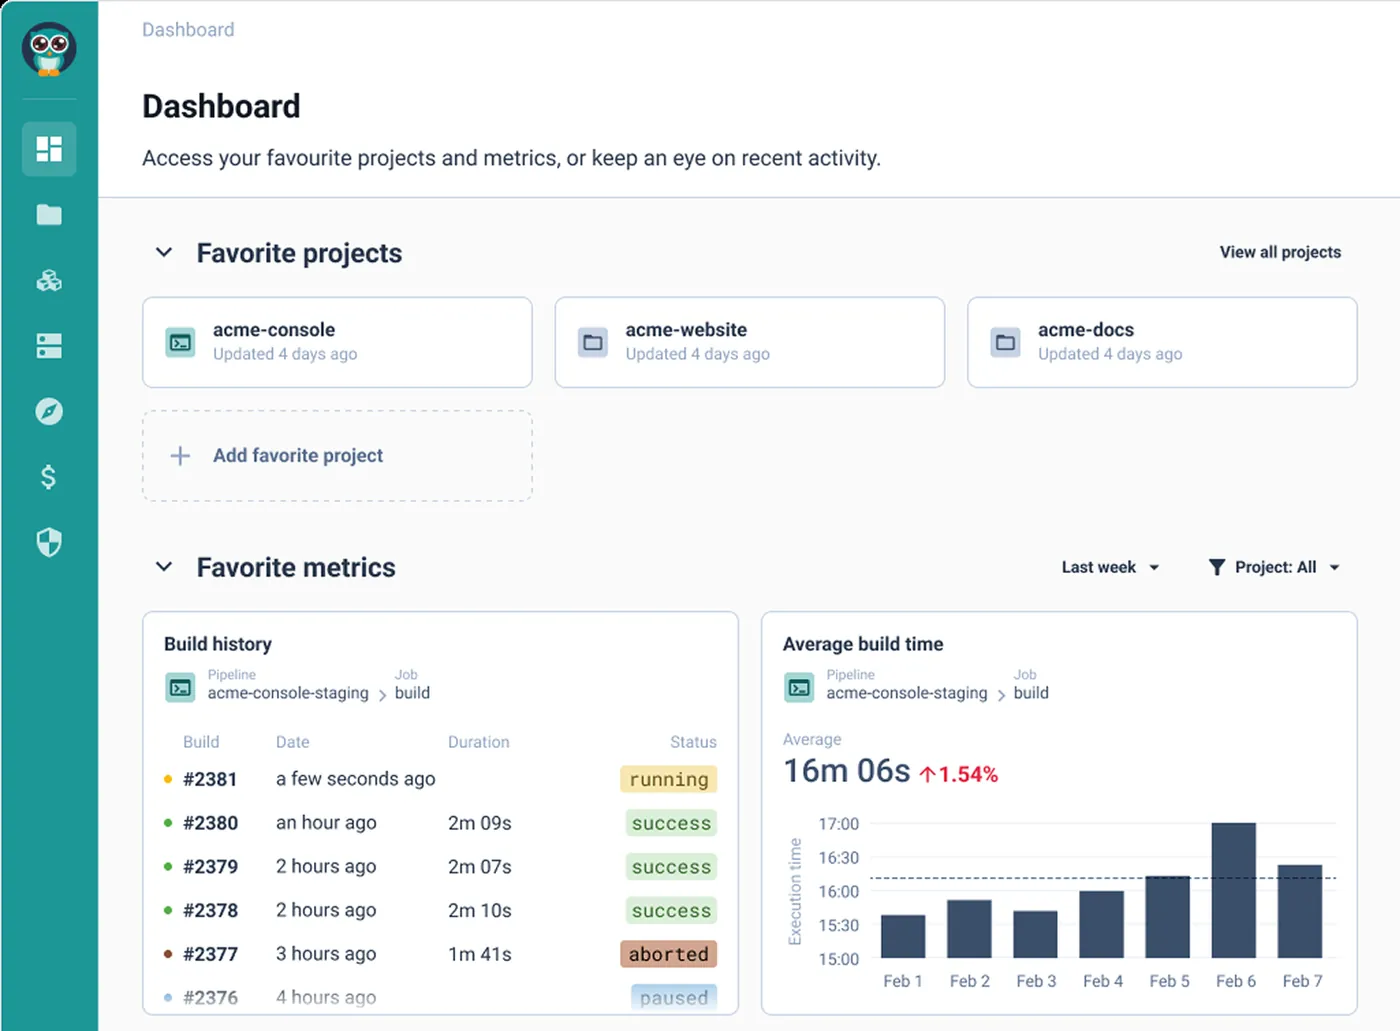
The Cycloid dashboard gives an on-call engineer a live build history with duration and status per pipeline run, so the first question during an incident, “what changed and when,” is answered without a Slack thread. The InfraView diagram below it maps every service dependency in the production environment from live state, not a manually maintained wiki, so scope assessment takes seconds rather than the 20-minute archaeology session that inflates MTTR figures on most teams. Both views update automatically as infrastructure changes, which means the diagram an engineer opens during an incident reflects reality. That combination, timestamped build history plus a live dependency graph, is what converts MTTR from a lagging vanity metric into an auditable number you can put in front of a CFO.
Developer Experience KPIs That DORA Cannot Capture
DORA tracks what ships; it doesn’t track what stops people from shipping in the first place. The two metrics below cover the cognitive-load layer that sits upstream of every delivery outcome DORA can see.
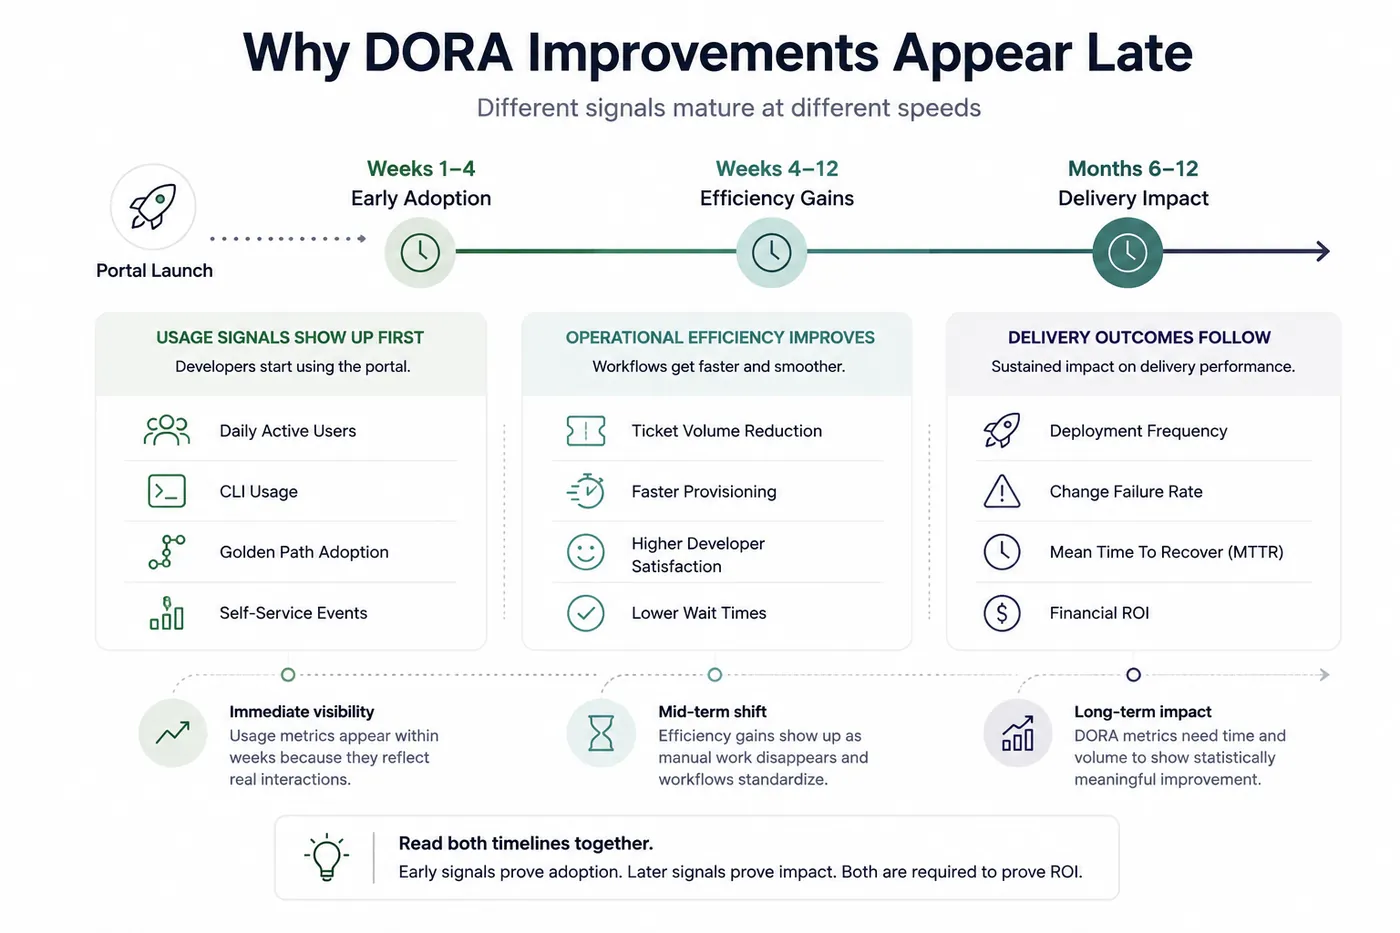
Platform adoption and delivery performance evolve at different speeds. Usage metrics appear almost immediately because developers start interacting with the portal from day one, while DORA metrics require months of deployment history before statistically meaningful trends emerge. Reading both timelines together prevents premature ROI conclusions.
Self-Service Rate and Cognitive Load Reduction
The percentage of infrastructure requests handled without an Ops ticket is the most direct measure of cognitive load reduction an IDP delivers. A developer who provisions a staging environment without opening Slack isn’t generating a DORA signal, but the time saved is real and auditable through portal event logs.
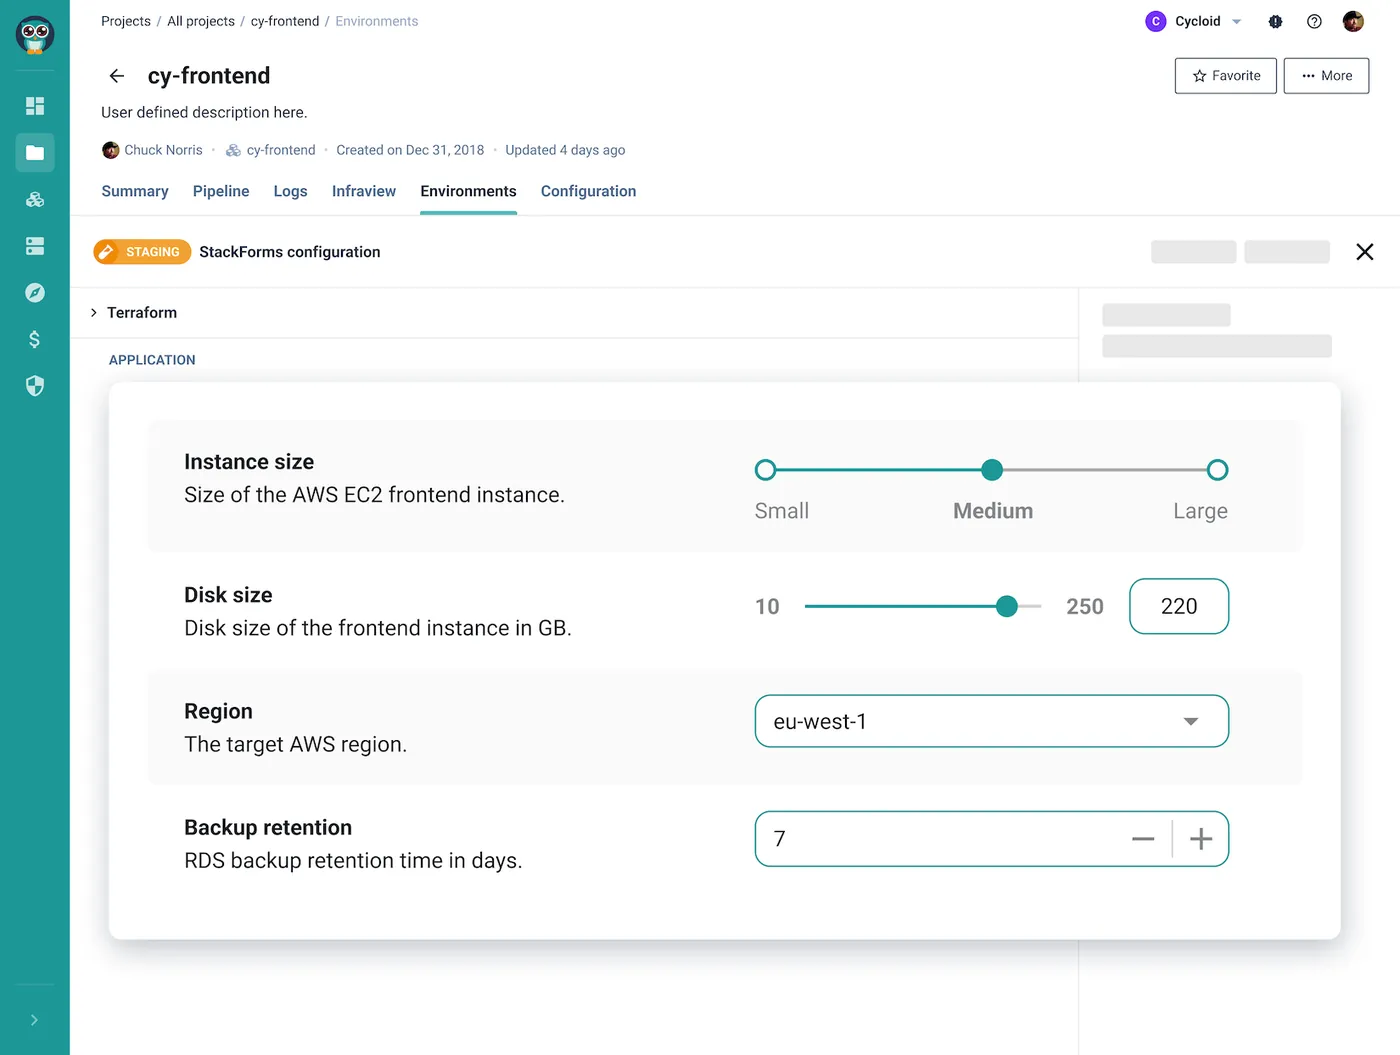
This StackForms panel is what a developer actually sees instead of an Ops ticket. Instance size, disk, region, and backup retention are all configurable within the boundaries the platform team defined in advance. Hence, the developer makes real infrastructure decisions without needing to understand the Terraform variables underneath. The platform team controls what’s exposed and what’s locked; eu-west-1 is pinned here, which means governance is enforced at the form level before a single resource is provisioned. Every submission through this form generates a timestamped event in the audit log, and that log is the raw data source for your self-service rate KPI.
Cycloid’s service catalog and StackForms capture every self-service action, giving platform teams a raw count of self-provisioning events per week. That count, tracked against the pre-deployment ticket baseline, produces a dollar-denominated time-savings figure when multiplied by loaded engineer cost.
Adoption Rate as the Leading Indicator Before DORA Outcomes Appear
DORA improvements take six to twelve months to appear as statistically meaningful deltas. Adoption metrics appear within weeks. Track daily active users, CLI usage rate (not just portal UI logins), and the percentage of teams that have migrated at least one workflow to the portal’s golden paths. These are the numbers to present at the 60-day check-in when DORA data is still too thin to be conclusive. A platform that 80% of developers use daily is demonstrably working, even before lead time numbers move.
Choosing the Metrics That Survive a Budget Review
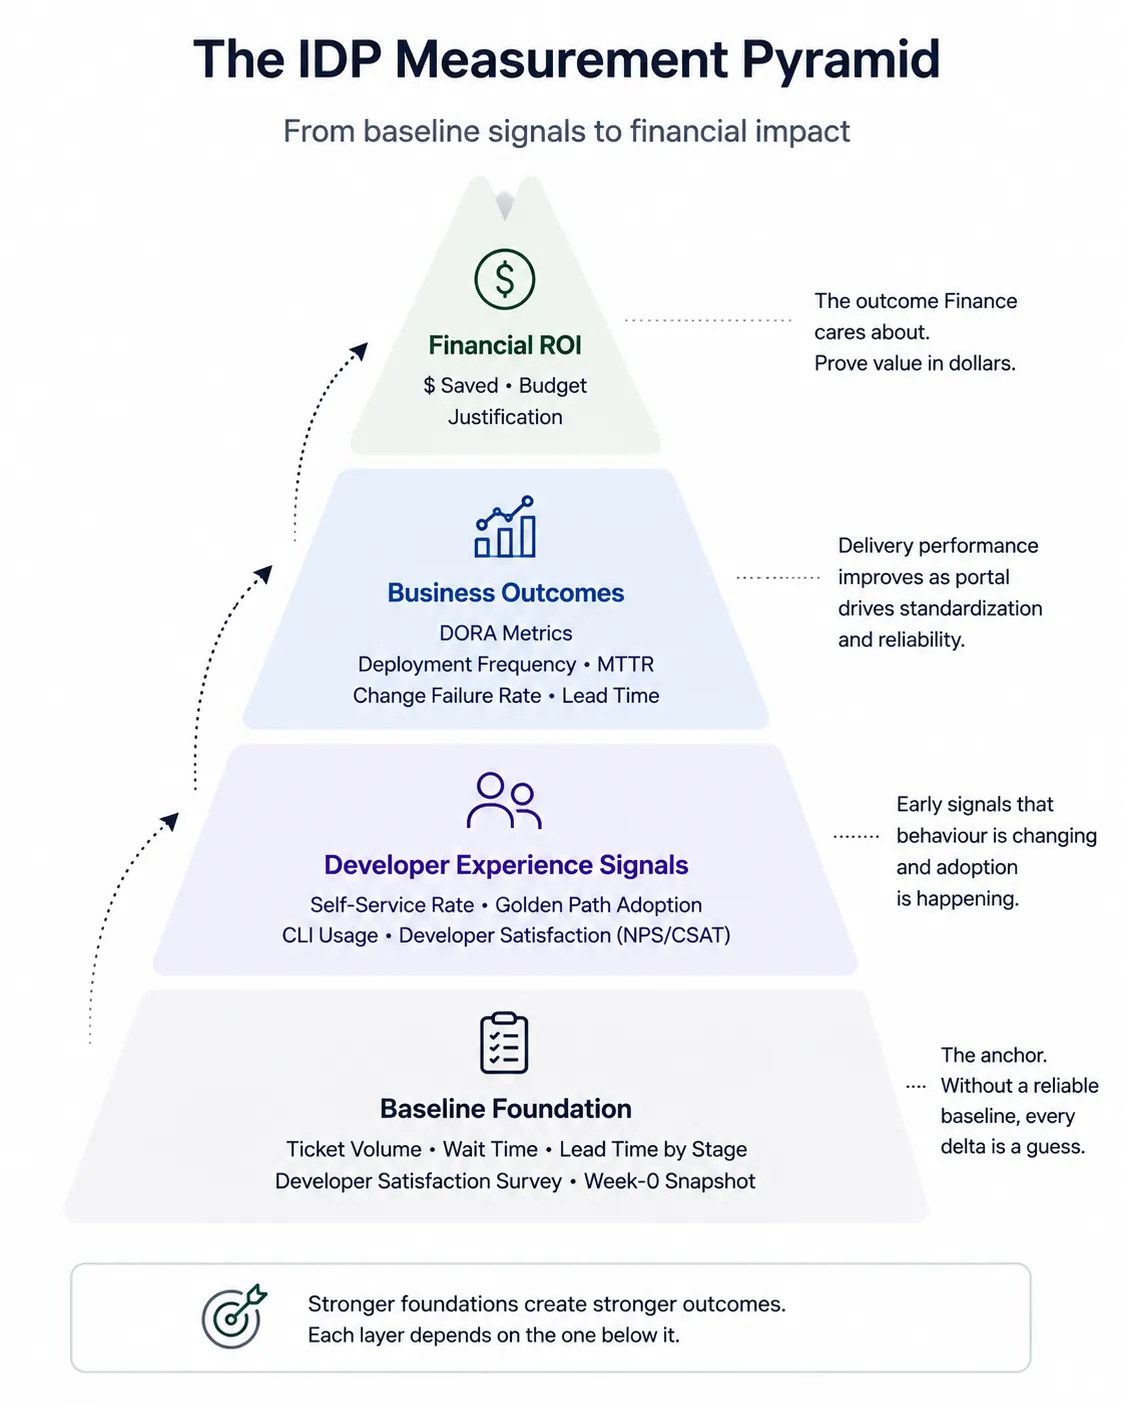
An internal developer portal doesn’t produce ROI directly. Financial outcomes emerge only after operational behavior changes, and those behavioral changes are only measurable if a reliable baseline exists before launch. Thinking of metrics as layers rather than independent dashboards makes the measurement strategy much easier to defend.
ROI calculation for IDPs follows a clear structure: (Total Value Generated – Total Cost) / Total Cost. The difficulty is in quantifying both sides accurately. On the value side, MTTR reduction, ticket volume reduction, and onboarding time savings each convert to engineer hours recaptured per month; multiply by loaded cost per engineer hour. On the cost side, include platform team time, the IDP license, and integration engineering. Cycloid’s documented benchmarks of 50% faster project delivery and 40% reduced cloud costs give client-specific entry points for the value side, but verify your own numbers against the Asset Inventory and Cloud Cost Management dashboards before presenting to finance.
Every metric in your IDP measurement stack should pass one of two tests: it either prevents funding from being pulled before DORA improvements become visible, or it connects directly to a financial figure finance can audit. A metric that fails both is instrumentation overhead. Build the measurement stack around the metrics that hold up in the room, not the ones that feel comprehensive on a dashboard.
This article covered three measurement layers: the pre-deployment baseline that makes delta measurement possible, the adapted DORA metrics that tie portal behavior to delivery outcomes, and the developer experience KPIs that cover the cognitive-load work DORA misses entirely. Those three layers, tracked from go-live with a confirmed week-0 baseline, produce the audit trail a CFO can interrogate at year-end.
FAQs
1. What DORA metrics should I track to measure an internal developer portal’s impact?
Deployment frequency, change failure rate, lead time for changes, and MTTR are the four core metrics. For a portal specifically, track golden-path adoption rate alongside deployment frequency: rising deployment frequency while golden-path adoption stays low means developers are shipping but bypassing the portal’s governance layer.
2. How long does it take to see ROI from an internal developer portal?
Adoption metrics appear within weeks. Ticket volume reduction and self-service rate changes show up within 30 to 60 days. DORA metric deltas that are statistically meaningful typically require six to twelve months of post-go-live data. Plan your executive check-ins around that timeline and lead with adoption metrics at the early reviews.
3. How do you calculate developer productivity savings from an IDP?
Start with hours saved per developer per week on provisioning, ticket waiting, and environment setup. Multiply by the number of developers, then by loaded cost per engineer hour. A conservative baseline is one hour saved per developer per week; even at that rate, a 50-engineer org returns substantial annualized savings against a commercial IDP license.
4. Can self-service portal adoption rate replace DORA metrics as an IDP KPI?
No, but it should precede them. Self-service rate is a leading indicator that confirms developers are using the portal, which is the precondition for any DORA improvement. DORA metrics measure whether the portal is producing delivery outcomes. Both are needed: adoption rate for early-stage proof, DORA metrics for year-one business case.
Check our Comparisons: Cycloid vs Backstage / Cycloid vs Port / Cycloid vs Humanitec