When you know exactly what you’re spending on and the cloud carbon impact of your deployments, you can take steps towards reducing it.
FINOPS SOLUTIONS
Control Multi-cloud costs and prove ROI
FinOps solutions help platform engineering teams control cloud spending before it escalates. By combining cost visibility, governance, and accountability, they bridge finance and engineering so teams understand the financial impact of infrastructure decisions.
Unlike native tools like AWS Cost Explorer or Azure Cost Management, FinOps platforms unify multi-cloud spend, connect costs to teams and projects, and enforce guardrails to prevent overruns.
Cycloid embeds FinOps directly in its platform, offering pre-deployment cost estimation, real-time usage tracking across AWS, Azure, GCP, and private cloud, plus unified multi-cloud budget dashboards, all in one place.
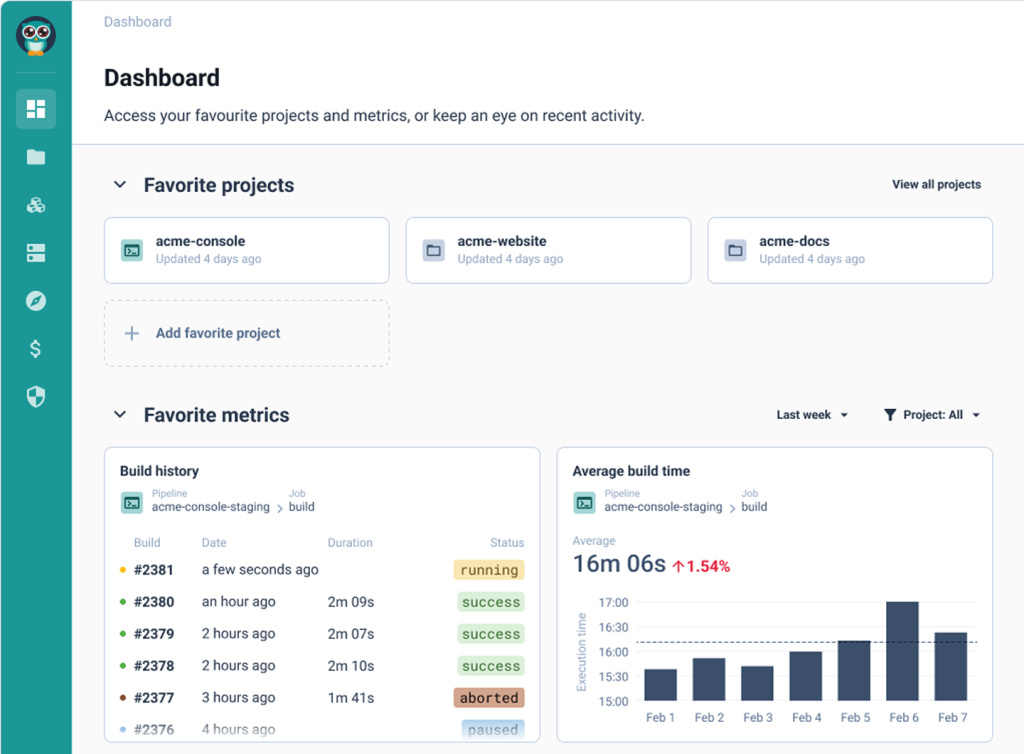
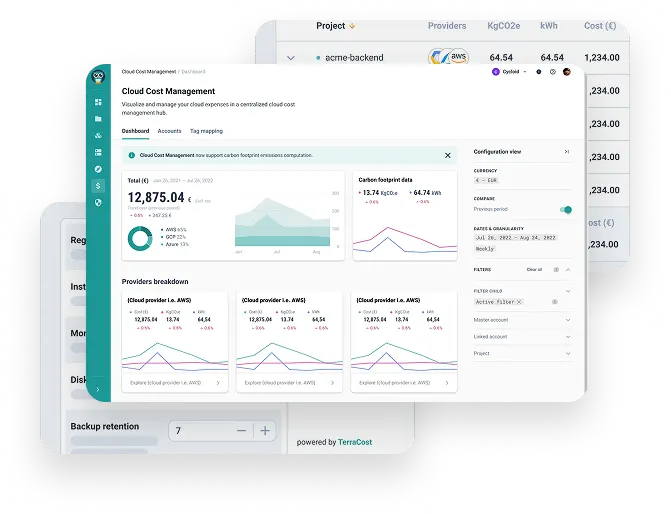
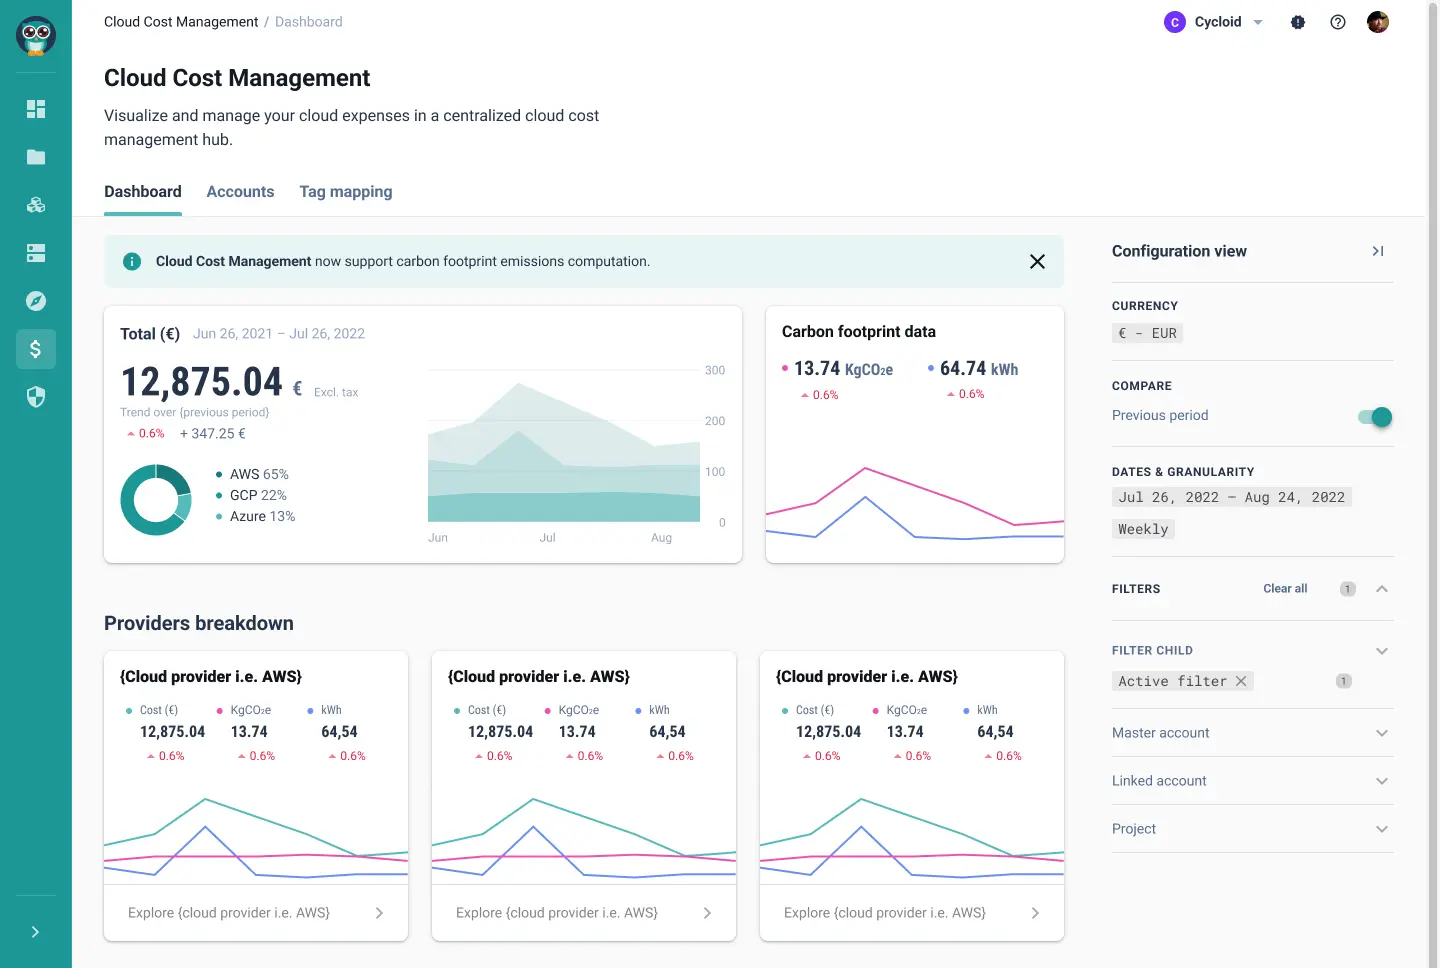
Hi. In this video, we're going to review the FinOps and GreenOps modules in Cycloid. You have two aspects for FinOps and GreenOps in Cycloid. You have an estimation of the cost of the infrastructure before deployment, just to make sure before you deploy something, you are not going to get surprised with the price. And we have another module to do cost analysis VMWare we are going to import the data from the different cloud providers and generate some reports. So let's get started. The first thing I want to show you is the cost estimation. So let's take, for example, this deployment here. Here we have the configuration, which is the stack form that the user has deployed. And here you can see, for example, we have, RDS Postgres. We have some Elasticsearch that's, the end user configure. So if you want to change, for example, the instance class, you can do so by changing here. If I want to estimate the cost of these deployments before we actually change or deploy anything, then I can push this button and then it is actually analyzing the Terraform code that is behind. And here the whole platform is going to cost three thirty USD per month. And here, if I push this button, you can see all the details of everything that is going to be deployed. So you can see we have S3 bucket. We have some EC2 instance. We have some RDS here, some ALB and so on and so forth. The other aspect is the cost analysis. So if I move to FinOps and GreenOps, here you can see we have a dashboard with some reports. First of all, you need to connect an account from your different cloud providers. We support AWS, Azure, and GCP for that. So it's pretty simple. If I take, for example, GCP, you need a credential and then you need to access a project ID and then a billing dataset and then consequently a BigQuery, table that, will, hold the data, the billing data. It is exactly the same principle for, the other cloud providers. And then once you have done that and the import is complete, then you can go to dashboard. And here you can see actually the FinOps widget, which is multi cloud. So you can have the quota of consumption for the different cloud provider we have imported within, of course, this date range. And we have selected here a granularity of daily in that case. So this is the FinOps module. And then we have a global carbon footprint data module as well that is, showing you the global trend. And that shows not only the carbon footprint in pink but also the energy consumption. So you can see, how the shapes behave, regarding this carbon emission and energy consumption. Then you have a provider break breakdown. And here you have, we have three cloud providers, AWS, GCP, and Azure. And then we have a breakdown per project. And this is actually very interesting because it uses the tag on the cloud resources directly. So it is actually summing up including the carbon footprint, energy consumption, and the cost. It is, summing up all the resources having project equals Cycloid SaaS in this case here as a tag attached to the resources summed up in these numbers here. So if I click on this one, we have, here some, graph and we can actually group this data according to, for example, the category. Okay. And category can be networking, compute, database, security. And then I have an idea of, how the cost is spread among this category on a daily basis here. And, this is, filtered always for my cycloid SaaS deployment project. And I can subgroup as well, For example, per service, let's say. Okay. And then if I go down in this table here, here I can see that, I am in the finance aspect. I can change the currency eventually. Here the currency is euro. I can change to USD or different currencies. And then here I have the categories, but I remember I have also subgroup, per, per service. So for example, if I do security, I can see in security, I have the AWS WAF, and I have also the KMS. And this is the cost associated to this particular project in this date range and with a granularity of daily, and this is the number are in euro. Okay. So you can change, whatever you you want here. You can even filter addition additional dimensions. So for example here, it's only in this region. But if I have several regions, I could filter per region, or even with additional tags if I want to. And the very interesting thing in Cycloid is that this calculation is actually also made exactly in the same way to calculate the carbon emission. So it's one click away, actually. Exactly the same grouping, exactly the same filtering is applied. And here, I can see my c o two equivalent, my carbon emission for my project. And in exactly in the same way, I can see the energy consumption for my, different categories. So here is the FineOps and GreenOps modules that Cycloid can propose. I hope you like this video and I see you in the next one.
What are FinOps solutions?
FinOps, short for Financial Operations, is the practice of bringing financial accountability to the variable-spend model of cloud computing. A FinOps solution makes this possible at scale: it gives engineering, finance, and leadership teams a shared, real-time view of what the organisation is spending, why, and what to do about it.
The cloud’s on-demand pricing model creates a fundamental accountability gap. Engineers provision resources without seeing the invoice; finance receives the bill weeks later with no way to trace costs back to the teams or projects that generated them. FinOps solutions close that gap by embedding cost awareness directly into engineering workflows.
According to Flexera’s 2025 State of the Cloud Report, organisations still waste approximately 27% of their cloud spend on IaaS and PaaS, and 84% cite managing cloud spend as their top cloud challenge.
The three pillars of a FinOps solution defined by the FinOps Foundation
Cycloid covers all three natively. Its TerraCost engine estimates infrastructure costs at the Terraform-plan stage, its Cloud Cost Management module consolidates multi-cloud spend into a single-panel view, and its governance layer enforces tagging and budget policies directly within the developer self-service portal.
Inform
Real-time dashboards showing who is spending what, on which cloud, and for which project, giving stakeholders a single source of truth
Optimise
Identifying waste through rightsizing recommendations, orphaned-resource detection, and reserved-capacity analysis so teams act on data
Operate
Embedding cost controls into CI/CD pipelines, enforcing tagging policies, and setting automated budget guardrails that prevent overspend before deployment.
What are the challenges?
Tick-tock goes the money clock…
It’s 2026 and no business can afford to ignore cloud costs and waste and let’s be honest – until now it’s been a messy business. Cloud expense data is spread across different providers’ interfaces, each with its own reporting system, so viewing them all in a centralized manner is impossible. Getting your cloud carbon footprint is even harder – at best, all you get are estimations and, at worst, incorrect or delayed data. That’s why we added our FinOps and GreenOps solutions in Cycloid.
If you’re looking to take real control of your cloud usage and reduce cloud waste and your carbon footprint, Cycloid has something for you.
Cloud costs are the very last thing you should leave to chance
How does Cycloid help?
Cost prediction built-in from the ground up
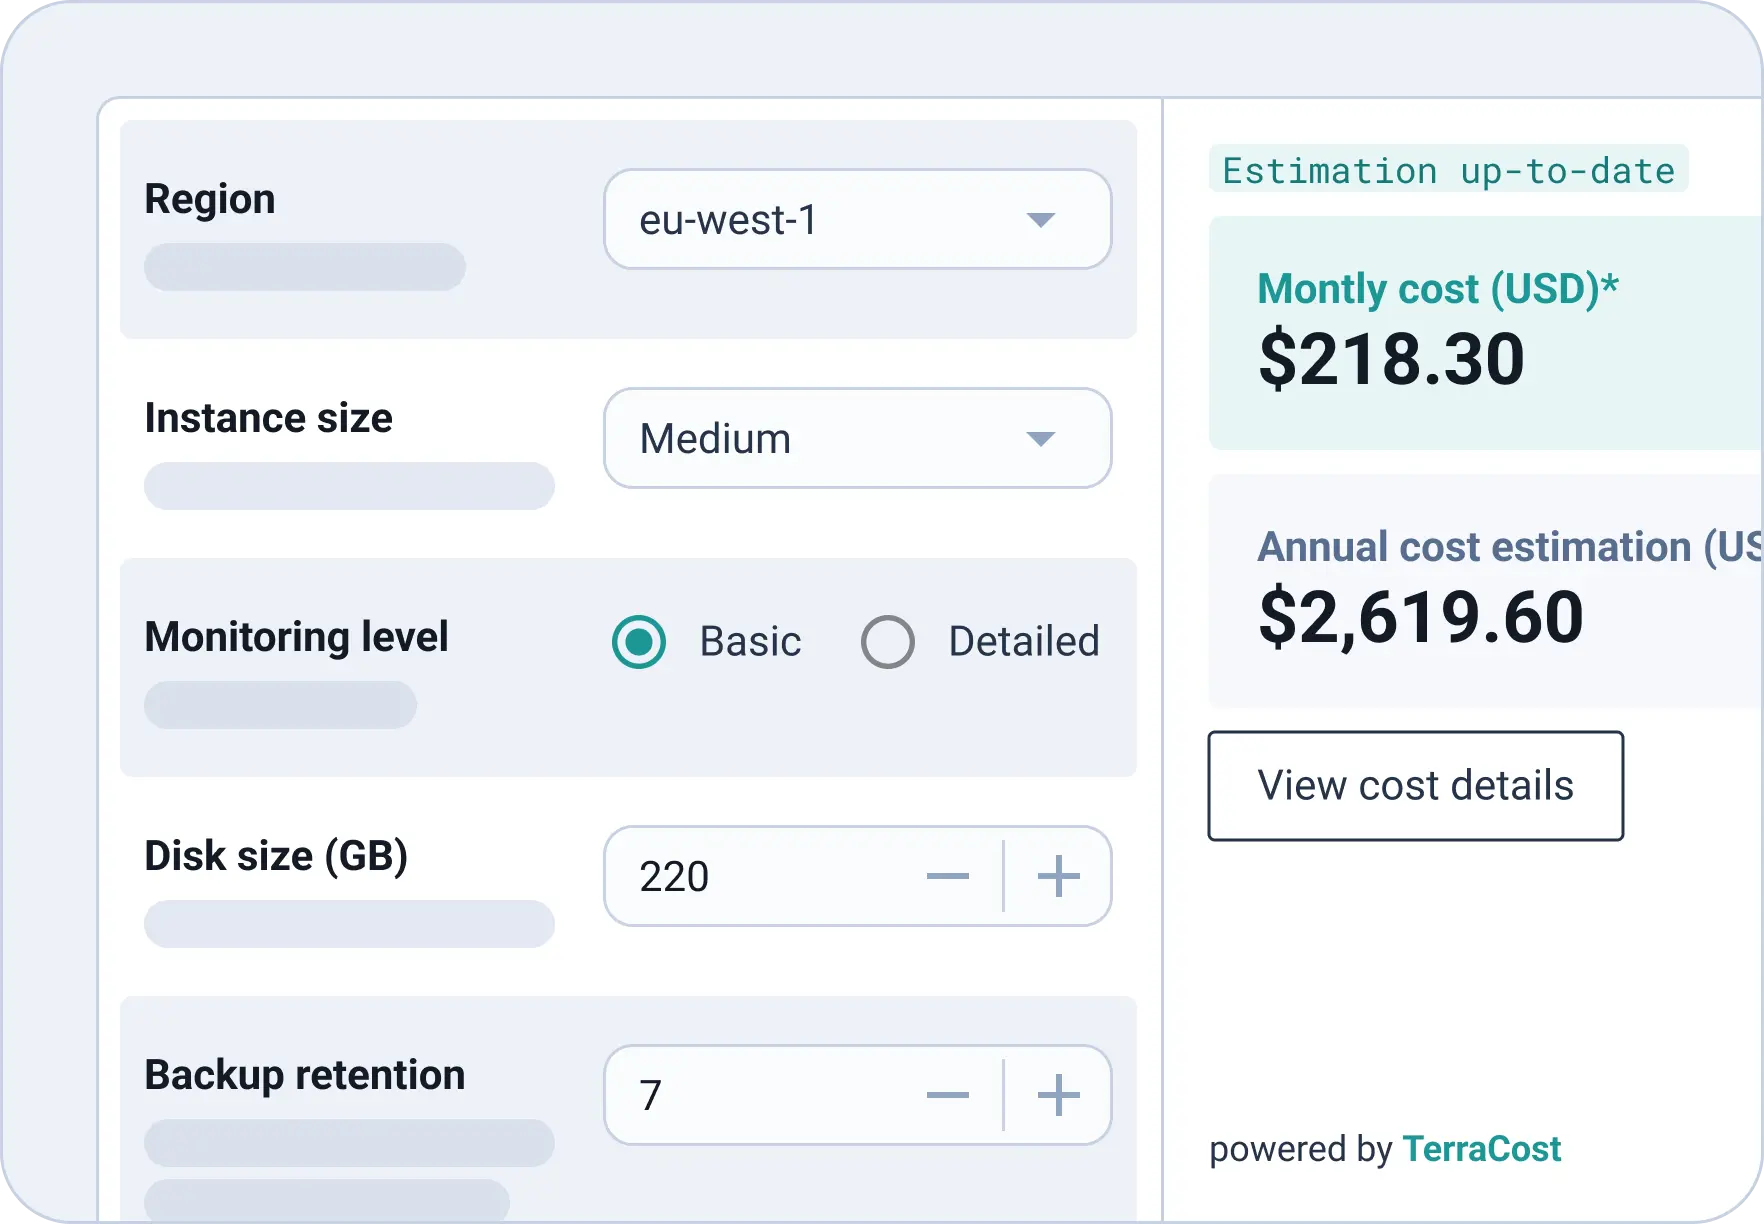
Wouldn’t it be nice to see how much you’re spending before deployment? Cycloid’s Cloud Cost Estimation – based on our open-source FinOps feature TerraCost – estimates the price of an infrastructure based on the related Terraform and is integrated into Pipelines and StackForms. Avoid unpleasant surprises by letting your end-users see the cost of their deployment before they hit run, and create a culture of shared business responsibility on your teams.
True cost visibility
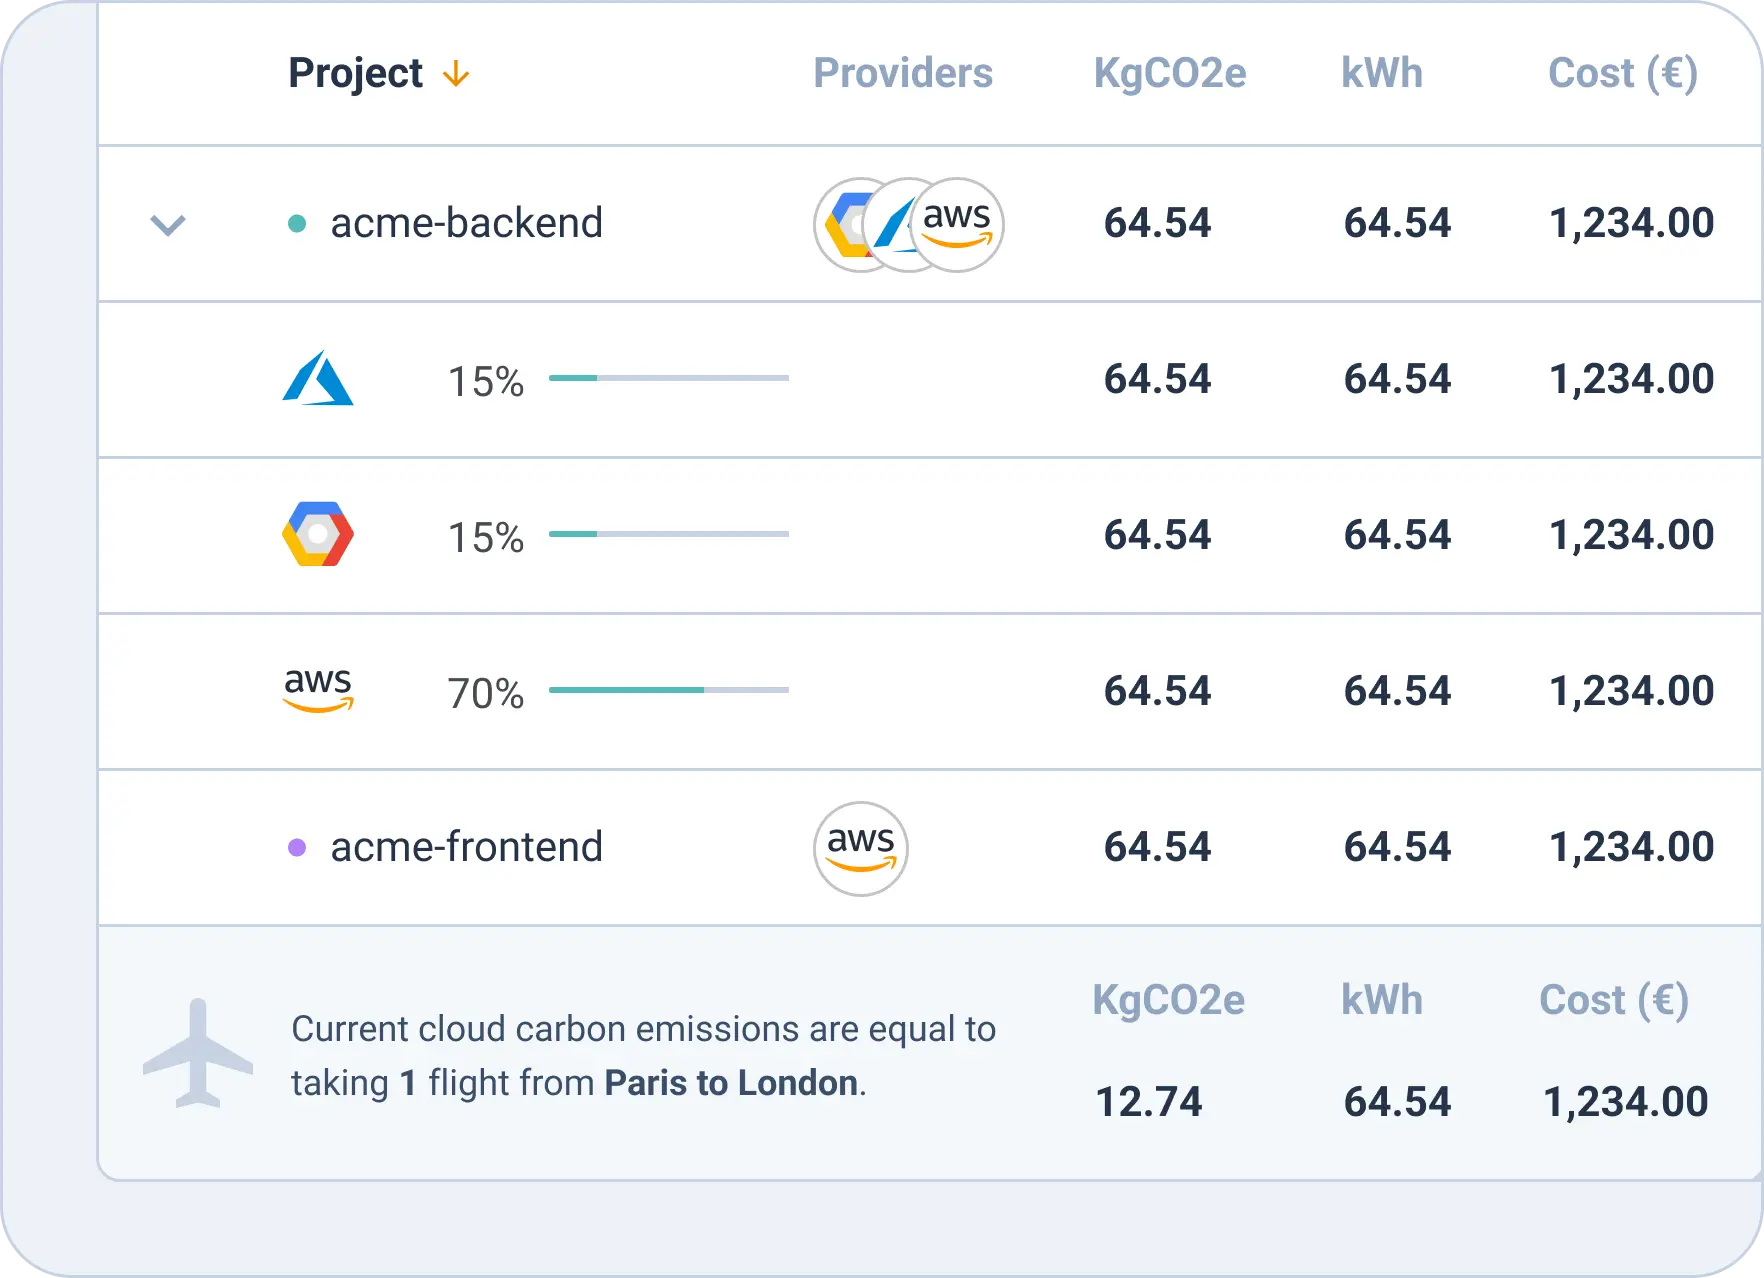
Centralize and monitor all your cloud expenses in a single place. Our built-in Cloud Cost Management module gives you a graphical representation of your costs in a single panel view which you can filter by project, provider (AWS, Microsoft Azure, Google Cloud Platform), tag, region, date, and more.
Reduce cloud waste
An average company wastes 40% of its (contracted and paid for) cloud resources… Not only is this financially inefficient, but it’s also very harmful to the environment. Our FinOps module comes with a built-in Cloud Carbon Footprint feature that allows you to take a deeper look at your cloud carbon emissions and take better, environmentally-conscious decisions when it comes to cloud consumption.
Asset management made easy
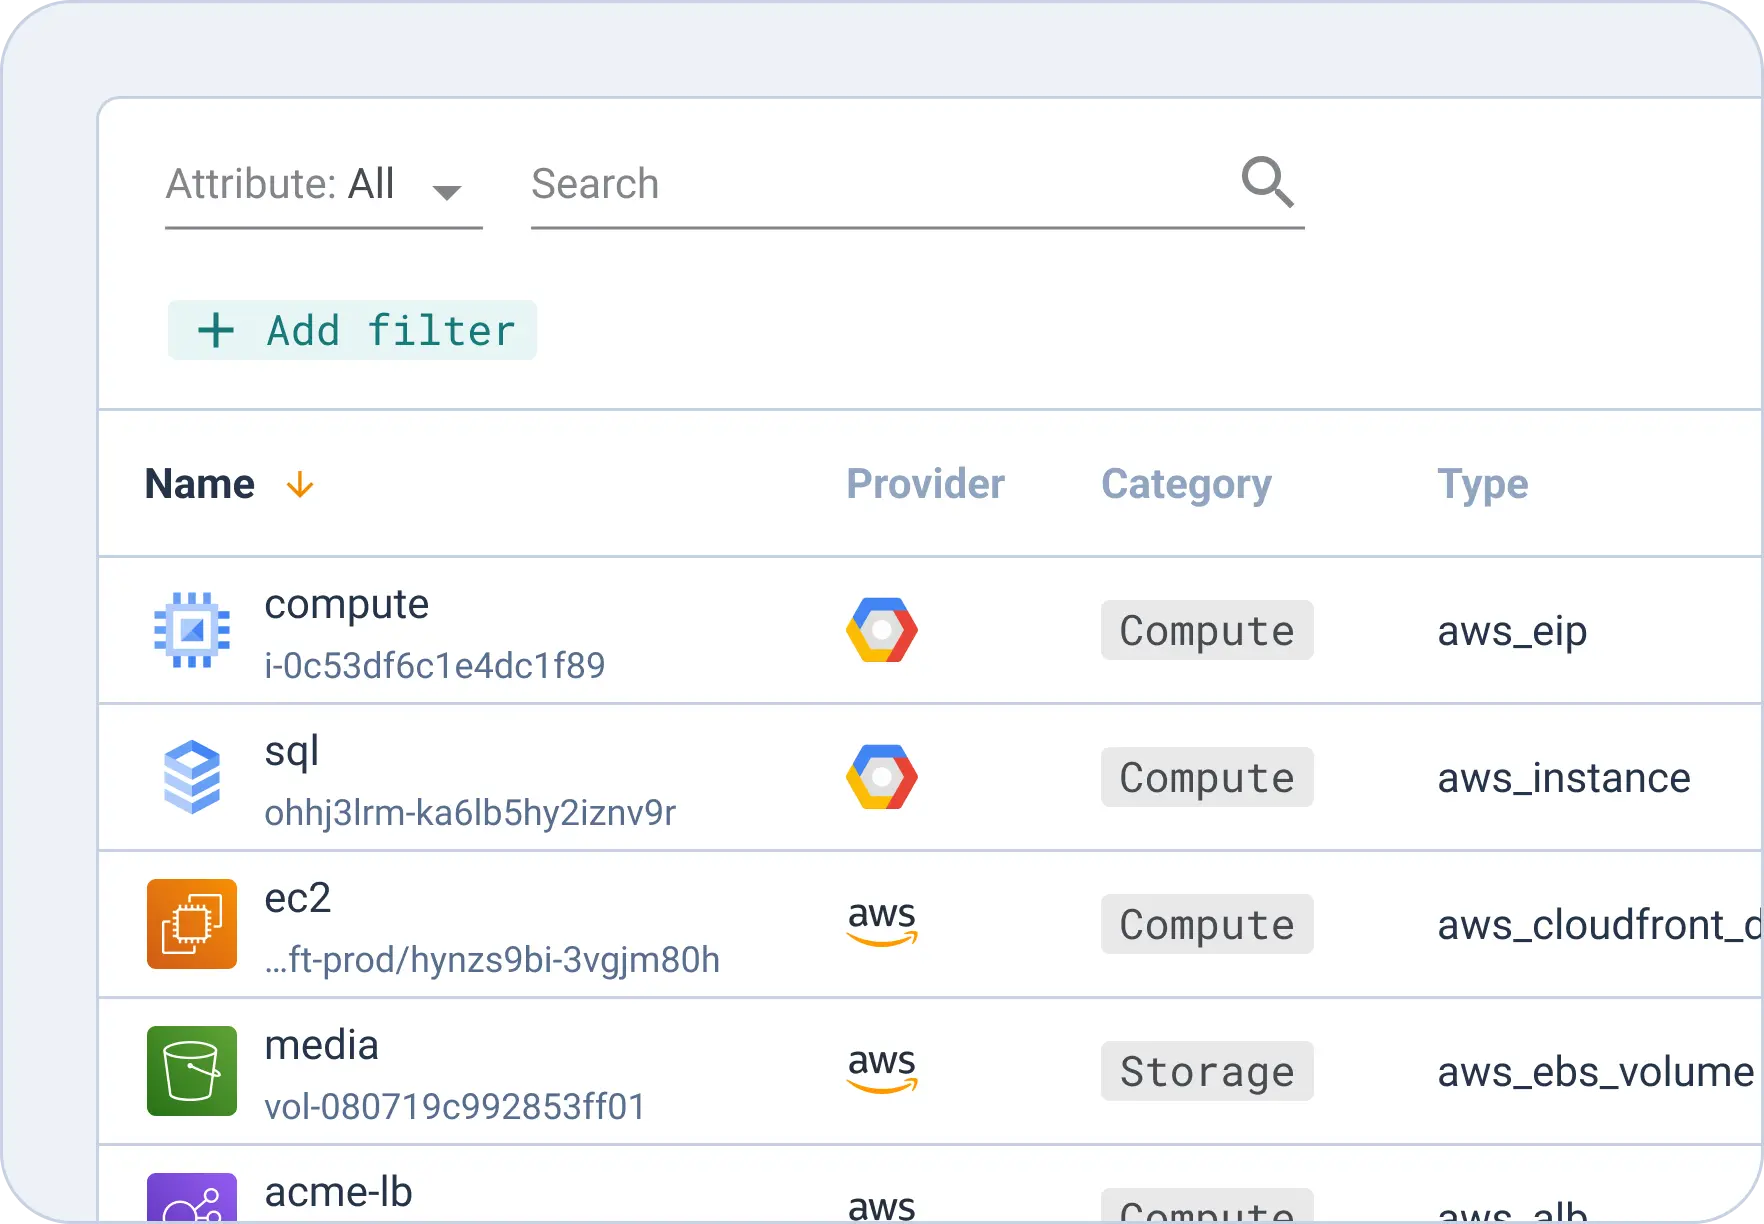
Never lose another gigabyte! Our Asset Inventory module allows you to view all your public and private cloud resources in a single panel, so you know exactly how much has been used by project, team, provider and more. Worrying about overusing private cloud resources? Create resource quotas in Quota Management and allocate private cloud assets (Nutanix, VMWare) per team.
See how Cycloid compares to Native Cloud Tools
Engineering teams that rely solely on native cloud-provider dashboards (AWS Cost Explorer, Azure Cost Management, GCP Billing) often hit a ceiling: no pre-deployment estimates, no multi-cloud consolidation, and limited governance. The table below shows how Cycloid’s FinOps module compares across six areas that matter most to platform and engineering leaders.
Criteria
AWS Cost Explorer / Native Tools

Cycloid FinOps
Pre-deployment cost estimation
Not available – costs visible only after deployment
Built-in via open-source TerraCost engine; estimates at Terraform-plan stage
Multi-cloud consolidated view
Partial — one dashboard per provider; no unified view
AWS, Azure, and GCP unified in a single-panel dashboard
Governance & policy enforcement
Limited — no pre-deploy guardrails or budget gates
Automated pre-deployment policies via StackForms and pipelines
Automated tagging & cost allocation
Manual per-account configuration; inconsistent across clouds
Tags inherited from Stacks; consistent across all environments
Team-level budget dashboards
Partial – account-level only; no project or team granularity
Filterable by team, project, tag, region, and provider
Carbon footprint tracking (GreenOps)
Not available natively from any major cloud provider
Built-in Cloud Carbon Footprint module (CCF); non-optional
Outcomes with Cycloid
Closer monitoring
No more prescriptive cost control or unexpected expenses – if everyone’s responsible for cost management, nothing gets lost in translation.
Greater visibility
Transparency and collaboration lead to better cloud decisions and safer innovation.
Reduced costs
FinOps can’t be the weakest link if you’re really set on success - find a better way
Frequently Asked Questions
What are FinOps solutions?
FinOps solutions are platforms and practices that give engineering and finance teams shared, real-time visibility into cloud spending. They combine pre-deployment cost estimation, automated resource tagging, multi-cloud budget dashboards, and governance policies in a single workflow. The goal is to shift cloud cost management from a reactive, end-of-month exercise to a proactive, continuous practice embedded in the engineering lifecycle. The FinOps Foundation defines three phases, Inform, Optimise, and Operate, that a mature FinOps solution should support.
What is the best FinOps solution for multi-cloud teams?
The best FinOps solution for multi-cloud teams consolidates AWS, Azure, and GCP spend into a single dashboard, supports pre-deployment cost estimation, and enforces consistent tagging and governance across all providers. Cycloid meets these requirements natively: its Cloud Cost Management module unifies multi-cloud billing data, its TerraCost engine estimates costs before deployment at the Terraform-plan stage, and its StackForms self-service portal ensures every resource is tagged and policy-compliant from day one.
How do FinOps solutions reduce cloud costs?
FinOps solutions reduce cloud costs in three ways. First, they surface cost estimates before deployment so teams can adjust configurations before money is spent. Second, they tag every resource and allocate costs to specific teams and projects, eliminating “shadow spend” that no one owns. Third, they enforce governance policies such as budget caps and instance-type restrictions that prevent overspend automatically. According to Flexera’s 2025 State of the Cloud Report, organisations waste an average of 27% of their cloud budget, making these controls essential.
What is the difference between FinOps and cloud cost management?
Cloud cost management is a reactive discipline focused on tracking and reporting expenses after resources are provisioned. FinOps goes further: it is a proactive framework that embeds financial accountability into every stage of the cloud lifecycle, from infrastructure design to daily operations. Where cloud cost management shows you what you spent last month, a FinOps solution helps you control what you will spend tomorrow through pre-deployment estimation, automated tagging, and real-time budget guardrails.
How do I implement a FinOps solution in my organisation?
You will need four steps to implement a FinOps solution in your organisation, with Cycloid supporting all steps out of the box, with no additional FinOps tooling required.
- Consolidate all cloud-provider billing data into a single dashboard so every stakeholder sees the same numbers
- Enforce a consistent tagging strategy that maps every resource to a team, project, and environment
- Introduce pre-deployment cost estimation so engineers see the financial impact of their configurations before they deploy
- Set automated budget alerts and governance policies that flag or block deployments that exceed approved thresholds.
Discover Cycloid now
Put your people in control, make software delivery more efficient, manage your cloud costs – and help the planet with our sustainable Platform Engineering platform.