






OPENSOURCE / INFRAMAP
Visualise Your Terraform Infrastructure in Seconds
Inframap is Cycloid’s open-source IaC visualisation tool. Point it at any Terraform or Terragrunt state file and get a clean, human-readable infrastructure map in seconds – without the noise of Terraform’s native graph command.

Inframap is an open-source Infrastructure-as-Code (IaC) visualisation tool developed by Cycloid. It reads Terraform or Terragrunt state files and generates a clean, human-readable infrastructure map showing resources and their dependencies – filtering out the noise that Terraform’s native graph command produces. Inframap supports major cloud providers including AWS, Azure, and GCP. It runs as a CLI tool and outputs maps in PNG or DOT format. It is designed to be run in seconds on any existing Terraform codebase without additional configuration.
What is InfraMap?
Inframap is a command-line tool that takes a Terraform state file (or a Terraform working directory) as input and produces an infrastructure diagram as output. The diagram shows what actually exists in the cloud – VPCs, subnets, VMs, databases, load balancers, IAM roles – and how those resources depend on each other.
The tool exists because Terraform’s built-in terraform graph command produces output that is technically accurate but visually unreadable on anything larger than a toy environment. Terraform’s graph shows the internal dependency structure, including provider metadata and state bookkeeping. Engineers looking at it typically say some variant of “I need something cleaner.” Inframap is the cleaner version: a resource-level graph filtered to what humans actually care about.
Supported providers (Q1 2026):
- Amazon Web Services (AWS) – full coverage
- Microsoft Azure – full coverage
- Google Cloud Platform (GCP) – compute, storage, network, IAM
- OpenStack
- Additional providers via the plugin architecture
Inframap is used inside Cycloid’s InfraView module to power the real-time infrastructure visualisation that platform teams see in the IDP. The same engine, exposed as a standalone open-source CLI for teams that want the visualisation without adopting the full platform.
Inframap vs Terraform Graph: Key Differences
The most common question from developers evaluating Inframap: is this different enough from terraform graph to bother with a separate tool? The short answer is yes; the longer answer is in the table below.
CRITERIA
TERRAFORM GRAPH
INFRAMAP
Output readability
Dense, includes internal Terraform bookkeeping (provider, root_module, meta nodes)
Clean, resource-only, filtered to real cloud objects
Provider support
Generic (any provider Terraform supports)
Provider-aware for AWS, Azure, GCP, OpenStack – understands resource types and relationships
Setup required
Built into Terraform CLI
Single binary install (brew, go install, Docker)
Terragrunt support
Manual multi-state assembly
Native (handles Terragrunt state layouts cleanly)
Output formats
DOT (Graphviz)
DOT + direct PNG rendering
IDP integration
None
Native (powers Cycloid InfraView)
Best for
Debugging Terraform module dependencies
Producing shareable, human-readable cloud diagrams
The honest read: terraform graph is fine when you need to debug Terraform module dependencies at the tooling layer. Inframap is what you want when a human needs to look at a picture of the infrastructure and understand it in under 30 seconds.
Quick-Start Guide
Run Inframap on Your Codebase in 3 Steps
Get from zero to a rendered infrastructure diagram in under 5 minutes.
STEP 1
Install Inframap
Pick your preferred package manager:
# macOS / Linux via Homebrew
brew install cycloidio/tap/inframap


# Any Go 1.20+ environment
go install github.com/cycloidio/inframap@latest


# Docker (no local install)
docker pull cycloidio/inframap
p
Confirm the install: inframap version.
STEP 2
Point Inframap at Your Terraform State or Directory
Two supported inputs:
# Against a Terraform state file (most common)
inframap generate terraform.tfstate


# Against a Terraform working directory (parses .tf files)
inframap generate ./my-terraform-project


# Against Terragrunt state
inframap generate --tfstate .terragrunt-cache/xyz/terraform.tfstate
The command outputs a Graphviz DOT graph to stdout by default.
STEP 3
Render the Diagram
Pipe the DOT output to dot (part of Graphviz) to produce a PNG, SVG, or PDF:
# Render to PNG
inframap generate terraform.tfstate | dot -Tpng > infra.png


# Render to SVG for embedding in docs
inframap generate terraform.tfstate | dot -Tsvg > infra.svg


# One-liner for CI/CD: generate + upload
inframap generate terraform.tfstate | dot -Tpng | aws s3 cp - s3://my-docs/infra.png
g
If Graphviz is not installed: brew install graphviz on macOS, apt install graphviz on Debian/Ubuntu, or use the Docker image which bundles it.
That is it. For continuous documentation, wire the same commands into your CI/CD pipeline so the diagram regenerates on every Terraform state change. Cycloid’s Pipelines module handles this natively.
Community and Adoption
Inframap has been maintained as an open-source project by Cycloid since 2020.
1.9k+
GitHub stars
Active
Maintenance status
30+
Contributors
Inframap Inside the Cycloid Platform
Inframap is one of four open-source projects behind the Cycloid Internal Developer Platform.
Inframap
Terraform state → diagram
TerraCognita
Reverse-Terraform existing infra
TerraCost
Pre-deploy cost estimation
MCP Server
LLM-to-Cycloid bridge
Where Inframap ships as a CLI tool for individual developers, the Cycloid platform exposes the same visualisation engine through InfraView – a real-time infrastructure visibility module that runs continuously across AWS, Azure, GCP, and on-prem estates. Same technology, different consumption model. If you like the Inframap output and want it continuously updated in a team dashboard rather than regenerated by CLI, InfraView is the platform-native version.
INFRAVIEW
An open-source alternative to Cycloid’s star feature
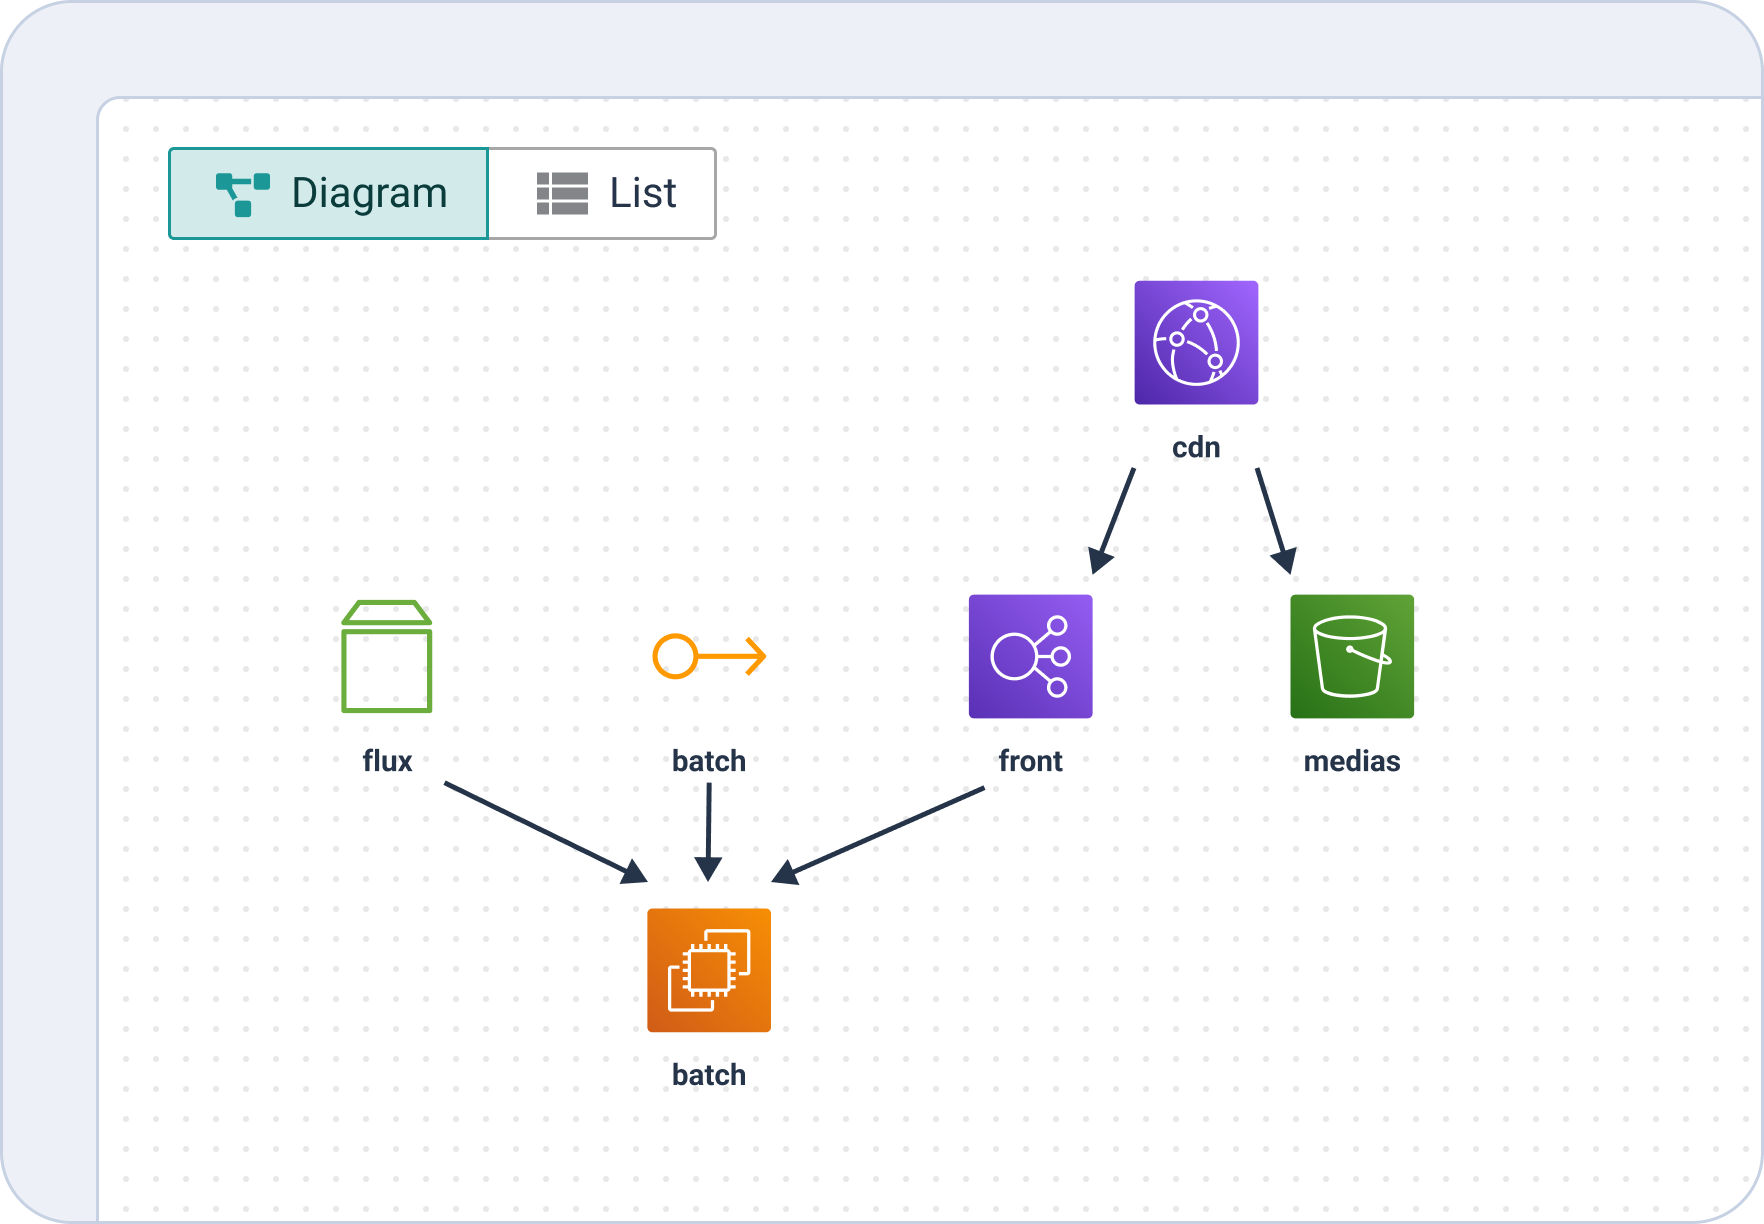
InfraView is InfraMap’s big sister and one of our most popular features. Embedded in the Cycloid platform, it builds more advanced maps with the detailed properties of each element on the diagram. It’s a tool with the wow-factor and is a genuine timesaver for devs, DevOps, and system architects the world over.
What's in it for you?
Infrastructure diagrams always up-to-date
Easy to update internal documentation
Save time on creating diagrams by hand
Supported cloud providers






The open-source cloud infra generator
Frequently Asked Questions
What is Inframap?
Inframap is an open-source Infrastructure-as-Code (IaC) visualisation tool developed by Cycloid. It reads Terraform or Terragrunt state files and generates a clean, human-readable infrastructure map showing resources and their dependencies – filtering out the noise that Terraform’s native graph command produces. Inframap supports major cloud providers including AWS, Azure, and GCP. It runs as a CLI tool and outputs maps in PNG or DOT format.
How does Inframap work with Terraform?
Inframap accepts a Terraform state file or a Terraform working directory as input. It parses the state, identifies the provider resources (aws_instance, azurerm_virtual_machine, google_compute_instance, etc.), builds a dependency graph, and prunes out the internal Terraform bookkeeping resources that clutter the native terraform graph output. The result is a diagram showing only the real infrastructure: VPCs, subnets, VMs, databases, load balancers, and their connections. Output is DOT format, easily rendered to PNG or SVG.
Which cloud providers does Inframap support?
Inframap supports the major cloud providers: AWS, Azure, Google Cloud Platform (GCP), OpenStack, and additional providers via the plugin architecture. Coverage is best on AWS and Azure (the two most-used providers in the Cycloid customer base). GCP support covers compute, storage, network, and IAM. For providers not natively supported, Inframap falls back to a generic resource graph that still improves readability over terraform graph.
What is the difference between Inframap and Terraform graph?
Terraform’s native graph command outputs the internal resource dependency graph as Terraform sees it – including provider metadata, module boundaries, and internal state resources. The result is dense and difficult to read on any non-trivial infrastructure. Inframap filters this output to show only the actual cloud resources and their real-world relationships, producing a diagram closer to what a cloud architecture whiteboard would look like. It also handles Terragrunt state and multi-module setups more cleanly.
How do I install and run Inframap?
Install Inframap via Homebrew (brew install cycloidio/tap/inframap), Go install (go install github.com/cycloidio/inframap@latest), or Docker (docker pull cycloidio/inframap). Run it against a Terraform state file with inframap generate terraform.tfstate | dot -Tpng > infra.png or against a Terraform working directory with inframap generate . | dot -Tpng > infra.png. The output is a Graphviz DOT graph that any dot-compatible tool can render.
Like InfraMap?
Cycloid’s InfraView gives you the same visualisation continuously updated across AWS, Azure, GCP, and on-prem – inside the broader IDP.