Day 2 operations are the ongoing post-deployment tasks required to keep infrastructure running reliably: monitoring, patching, scaling, incident response, and configuration drift management. In the day 0/1/2 model – standard across platform engineering and Kubernetes operations – day 0 is infrastructure design, day 1 is initial deployment, and day 2 is sustained operations. Platform engineering tools like Cycloid automate day 2 by embedding governance, observability, and cost control into the deployment pipeline.
Day 2 operations represent the longest and most resource-intensive phase in the infrastructure lifecycle – and the one most teams underinvest in. The day 0/1/2 model splits the infrastructure lifecycle into three phases: day 0 (design and planning), day 1 (deployment and provisioning), and day 2 (ongoing operations and maintenance). Most engineering organizations invest heavily in day 1 – building CI/CD pipelines, writing Terraform modules, and automating provisioning – but treat day 2 as something to figure out later. That gap between deployment and sustained operations is where incidents, drift, cost overruns, and compliance failures accumulate.
This guide provides a practical framework for day 2 operations, covering the full day 0 vs day 1 vs day 2 model, a concrete checklist of day 2 tasks, and how Internal Developer Platforms automate post-deployment complexity at scale.
Day 0 vs Day 1 vs Day 2: What’s the Difference?
The day 0/1/2 operations model provides a structured way to think about the infrastructure lifecycle. Each phase has distinct goals, activities, and tooling requirements – and the handoffs between them are where operational gaps appear.
| Phase | Definition | Key Activities | Platform Engineering Role |
| Day 0Design & Planning | Architecture decisions, requirements gathering, and establishing standards before any infrastructure is provisioned. | Architecture design, IaC template creation, compliance policy definition, identity and access strategy, technology selection, golden path design. | Platform team defines golden paths, reusable Stacks, governance policies, and StackForms templates that encode organizational standards. |
| Day 1Deployment & Execution | Provisioning infrastructure and deploying services into production for the first time. Time-bounded and deterministic. | Infrastructure provisioning via IaC, CI/CD pipeline execution, service deployment, initial configuration, smoke testing, DNS and networking setup. | Platform team provides self-service deployment via StackForms and Stacks – developers deploy without tickets or waiting. |
| Day 2Operations & Maintenance | The ongoing, open-ended phase of keeping infrastructure healthy, secure, compliant, and cost-efficient after deployment. | Monitoring and alerting, patching and upgrades, auto-scaling, incident response, configuration drift detection, cost governance, security scanning, backup testing. | Platform team automates ongoing day 2 operations via InfraView, Asset Inventory, InfraPolicies, and FinOps modules. |
The critical insight: day 0 and day 1 are time-bounded. You design once, deploy once (per release). Day 2 never ends. It runs for the entire lifetime of the infrastructure – which, for most production systems, is measured in years.
This is also where cost accumulates. Teams that spend months building CI/CD pipelines but have no structured approach to drift detection, cost governance, or incident response are investing in the smallest phase (day 1) while neglecting the largest (day 2).
Day One Operations: Why Day 1 Isn’t the Hard Part
Day one operations – the deployment and initial provisioning phase – absorb the majority of tooling investment in most organizations. Teams build sophisticated CI/CD pipelines, write comprehensive Terraform modules, and automate the path from commit to production. Day 1 gets attention because it is visible, measurable, and deterministic. You either deployed successfully or you did not.
Day 2 is different. Post-deployment operations are ongoing, unpredictable, and span multiple domains simultaneously: security, cost, performance, compliance, and developer experience. A Kubernetes cluster that deploys cleanly on day one can silently degrade over months through configuration drift, missed patches, or scaling policies that no longer match traffic patterns. The complexity of day 2 operations compounds because each new service, environment, and cloud account adds operational surface area that persists indefinitely.
The distinction matters for platform engineering teams: solving day 1 is a project. Solving day 2 is a discipline. The checklist and framework below address that discipline directly.
What Are Day 2 Operations?
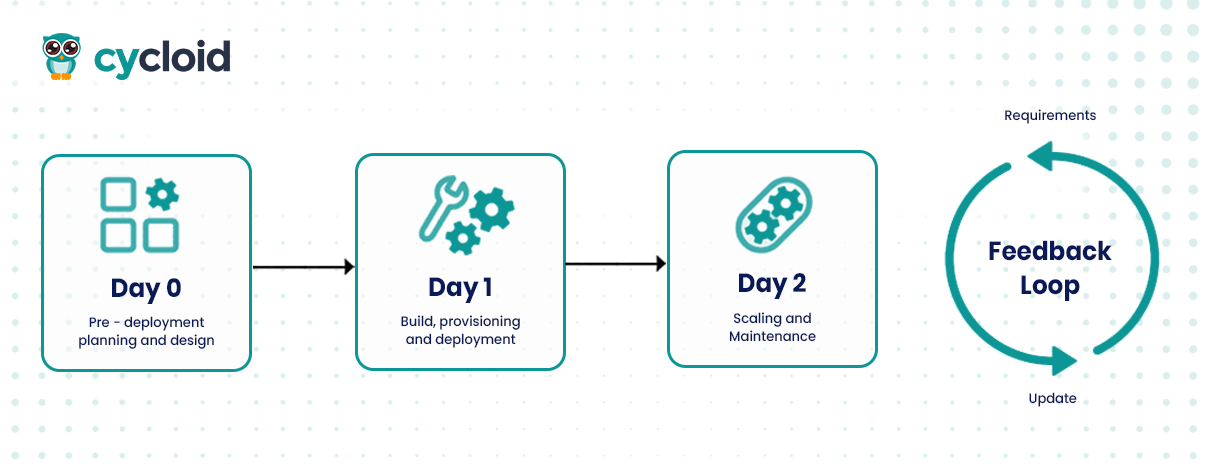
To understand Day 2, you have to rewind a bit and look at the three phases that make up the full lifecycle of cloud infrastructure and applications.
Day 0 is your planning ground. It’s where foundational decisions happen, cloud architecture, identity strategy, compliance policies, IaC templates, and even developer workflows. Think of it like sketching blueprints before constructing a building. You aren’t touching cloud resources yet, you’re defining standards, security boundaries, and architectural principles that everything else must follow.
Once the planning is solidified, Day 1 kicks in. This is execution day. Infrastructure is provisioned, services are deployed, and everything is wired up via CI/CD pipelines. Teams apply the templates, execute Terraform plans, run Helm charts, and deliver code into live environments. Day 1 is fast-paced but deterministic, you know what to deploy and where.
Then there’s Day 2, the real operational battleground. It begins the moment your application or infrastructure goes live and traffic hits the system. From this point on, your job isn’t just to run the system, but to keep it healthy, secure, performant, and cost-effective over time. This is where most teams underestimate the complexity.
What Day 2 Really Involves
If Day 0 and Day 1 are about creation, Day 2 is about maintenance and evolution. And maintenance doesn’t just mean uptime, it means handling everything that makes uptime possible in dynamic environments.
You’ll deal with autoscaling workloads, expired TLS certificates, observability gaps, runtime security, configuration drift, secrets rotation, and performance regressions. These aren’t just ops problems; they’re the daily reality for platform engineers, SREs, and developers responsible for production services.
A real-world analogy helps here: Day 0 is like deciding to open a restaurant and designing the floor plan. Day 1 is opening night, you hire the staff, cook the food, and welcome guests. Day 2 is every single day after that, keeping the kitchen clean, handling surprise health inspections, adjusting menus when ingredient prices spike, and replacing broken freezers before they shut down mid-service.
Why Day 2 Is a Blind Spot for Many Teams
The irony of modern DevOps is that it puts so much emphasis on deployment, it often forgets about post-deployment. Teams invest weeks in setting up CI pipelines but neglect long-term observability. They build IaC templates but have no way to detect drift or enforce policy compliance over time. When things break, it’s often not a provisioning bug, it’s a missing alert, a misconfigured HPA, or a system that silently degrades over months.
This happens because Day 2 isn’t a single action. It’s a sustained operational mindset. It requires tooling, automation, and process maturity that spans across cloud cost governance, performance tuning, incident response, and even internal developer experience.
What’s worse is that by the time most Day 2 problems are felt, they’ve already cost teams in terms of downtime, team burnout, or budget overruns. As an example, systems that lack proper observability often fall into what engineers call “black box failure modes”, situations where something breaks, but no one knows why or how to fix it.
The Numbers Back It Up
This isn’t just anecdotal. According to Gartner, 80% of enterprises will fail to operationalize cloud governance and observability by 2026. That’s a huge majority. And not because they lack engineers or platforms, but because they overlook Day 2 planning entirely.
The broader data supports this:
- 55% of cloud breaches in 2025 trace back to configuration drift or oversight (DataStackHub, 2025).
- The average cost of a cloud misconfiguration breach is $4.3 million, up 17% year-over-year (DataStackHub, 2025).
- Organizations take an average of 31 days to identify cloud waste and 25 days to detect overprovisioned resources (Harness FinOps in Focus Report, 2025).
- $44.5 billion in cloud infrastructure spend is projected wasted in 2025 on underutilized resources (Harness, 2025).
- Only 21.3% of engineering teams recover from deployment failures in less than one hour (DORA, 2025).
The average detection time for a configuration issue exceeds 180 days – but automation reduces detection time by more than 40% in mature environments (DataStackHub, 2025).
This trend reveals something sobering: the failure to plan for Day 2 is the biggest reason why cloud-native architectures become unmanageable at scale. Cloud usage isn’t slowing down, but operational complexity is compounding, and ignoring Day 2 responsibilities leads directly to downtime, compliance gaps, and developer frustration.
Why Day 2 is Important in Modern Infrastructure
In the past, infrastructure was mostly static. You had a few VMs or physical servers, some scripts to deploy applications, and basic logging to keep an eye on them. If something broke, you SSH’d into a box and fixed it manually. It wasn’t fast, but it was predictable.
Today’s infrastructure is wildly different. With containers, microservices, distributed tracing, and autoscaling systems, everything is in motion. A Kubernetes node can spin up and die in minutes. Traffic patterns change hourly. Engineers can deploy dozens of times a day without ever touching a staging environment. This flexibility is powerful, but it creates operational complexity that’s hard to manage without intentional Day 2 planning.
As a result, ops teams are no longer just infrastructure custodians. They’re now responsible for performance, cost control, governance, compliance, observability, and internal developer enablement, all in real time, across highly dynamic systems.
This shift means Day 2 isn’t just about keeping things running; it’s about managing a moving target with precision.
The Operational Cost of Ignoring Day 2
Neglecting Day 2 responsibilities leads to familiar patterns: mean time to recovery (MTTR) spikes because no one knows where the system broke. Service-level objectives (SLOs) are violated because teams rely on logs instead of full observability. Engineers burn out from constant on-call rotations with alert storms that offer no actionable insight.
Every minute spent debugging avoidable problems is a minute not spent improving the product. For growing startups and enterprise platforms alike, Day 2 inefficiencies translate directly into lost customer trust and engineering velocity. No matter how good your CI/CD is, if your system collapses quietly overnight, you’ll still be waking someone up at 3AM with a PagerDuty alert and no context.
Case Study: A Microservices Failure that Could’ve Been Avoided
Let’s take a real-world example. A mid-sized SaaS company running on Kubernetes had a microservices platform with over 40 services deployed. Each service had its own pod autoscaler but no central observability pipeline. One of the services responsible for user session validation began silently failing under load, it would drop requests intermittently but not crash. Since it didn’t trigger any alerts (it wasn’t configured to), the failure went unnoticed.
As traffic increased, users started getting logged out randomly. Support tickets surged. Eventually, another dependent service that required valid sessions started throwing 500 errors. A domino effect followed, crashing multiple services downstream. The response was chaotic: no one had traces across services, and logs were incomplete because Fluentd had crashed hours earlier without alerting anyone.
It took them 9 hours to identify the issue. The root cause? A misconfigured memory limit and a missing alert on request drop rate, both classic Day 2 gaps. If they had implemented service-level SLOs, distributed tracing, and alerting on business metrics (not just pod status), they could’ve caught the issue in minutes.
This is what makes Day 2 so critical: not reacting faster, but building systems that degrade gracefully and recover automatically, or at the very least, loudly.
Core Categories of Day 2 Operations
Day 2 operations can be overwhelming because they span multiple domains: security, performance, cost, visibility, compliance, and workflow automation. To make it actionable, let’s break it down into four core categories based on what platforms like Cycloid natively support. These aren’t just abstract labels, they’re interlocking pillars that allow a system to operate predictably over time.
1. Observability: Building Operational Awareness
At its core, observability is about answering this question: What is my system doing right now, and why? Metrics alone are not enough. You need the ability to correlate logs, metrics, traces, and metadata across services and environments, in real time.
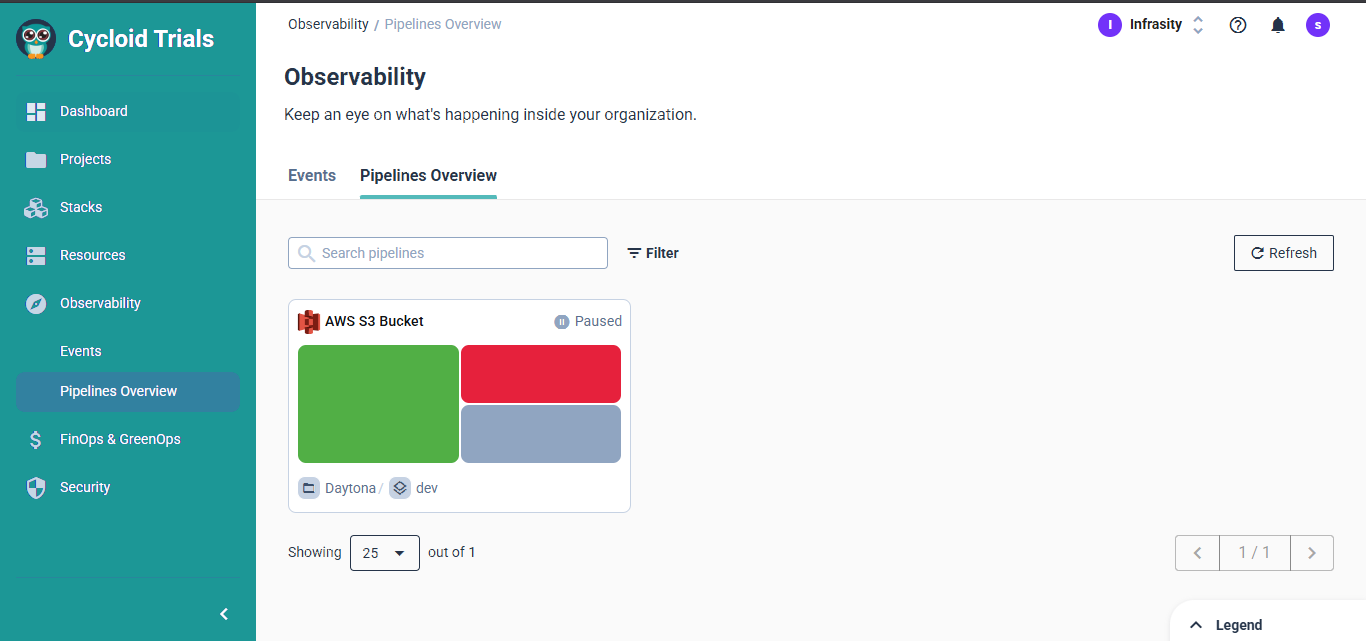
Cycloid tackles this with InfraView and asset inventory features. InfraView acts like a visual x-ray of your infrastructure, giving platform engineers and ops teams a single-pane-of-glass view into environments, services, and resources. Instead of jumping between cloud provider consoles, dashboards, and shell scripts, you can visually audit and analyze infrastructure state from one place.
This isn’t just useful for debugging, it’s essential for capacity planning, detecting misconfigurations, and maintaining production readiness. With better observability, you don’t just know that something broke, you know why and where, and you can fix it before your users notice.
2. Governance: Enforcing Policy Without Slowing Teams Down
Governance is where compliance and agility often clash. Security teams want rules and boundaries; dev teams want speed and autonomy. Day 2 governance is about reconciling these needs without either side losing control.
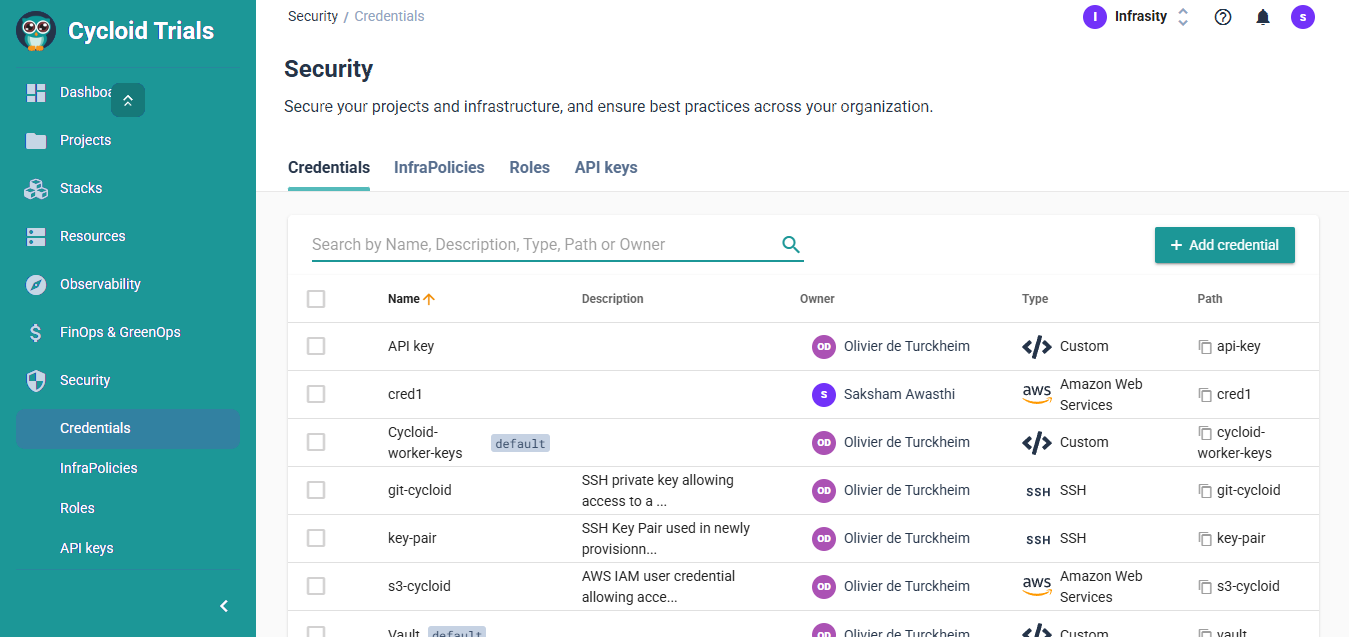
Cycloid helps by enabling policy-as-code, drift detection, and approval workflows in CI/CD pipelines. Rather than blocking deployments after the fact, teams can bake governance into Git workflows. That means quota enforcement, RBAC boundaries, or compliance policies are checked before code hits production, reducing surprises and post-mortem headaches.
Drift detection is especially critical. Imagine you deploy infrastructure via Terraform, but someone changes something manually in the cloud provider console. That change is now invisible to version control and could cause cascading issues later. Cycloid alerts you to this kind of drift early, so you can resolve it or re-align infra states before things break.
3. Automation: Scaling Your Ops Without Growing Your Team
A huge chunk of Day 2 friction comes from manual, repetitive tasks: provisioning environments, rotating secrets, onboarding teams, applying hotfixes, restarting pods, updating Helm charts. The more you scale, the more this becomes unsustainable.
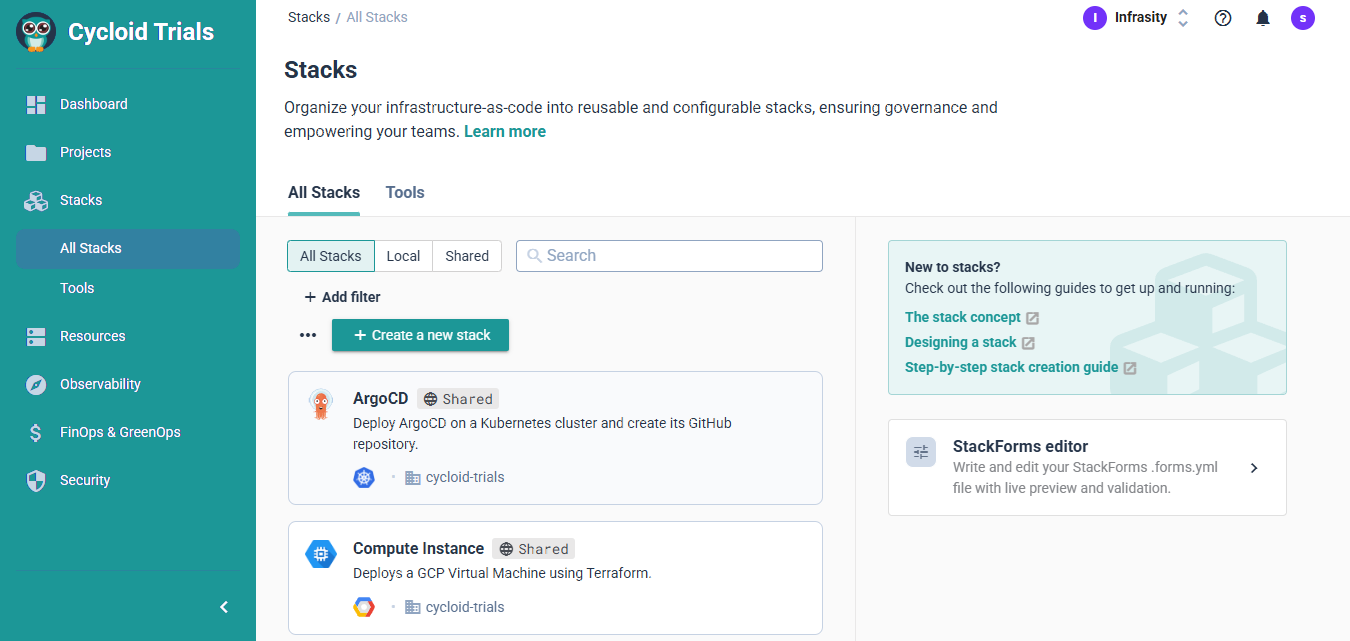
Cycloid addresses this with StackForms, GitOps-driven Stacks, and CI/CD pipelines that are reusable, version-controlled, and modular. Instead of crafting YAML files or hand-tuning Jenkins jobs, teams can deploy infrastructure and applications from declarative templates, with guardrails in place.
This is more than convenient. It’s how you scale operations across squads without duplicating effort or introducing drift. Imagine onboarding a new team: with StackForms, they can spin up their own environments with pre-approved infrastructure blueprints in minutes, all while complying with org-wide policies.
That’s what Day 2 automation is about, not replacing engineers, but giving them tools that reduce toil and let them focus on meaningful work.
4. FinOps: Aligning Cloud Spend With System Behavior
Cost is the silent killer in cloud-native environments. Engineers don’t always have visibility into spending, and by the time finance notices a spike, it’s too late to adjust. What you need is real-time, developer-accessible insight into how infrastructure decisions impact cost.
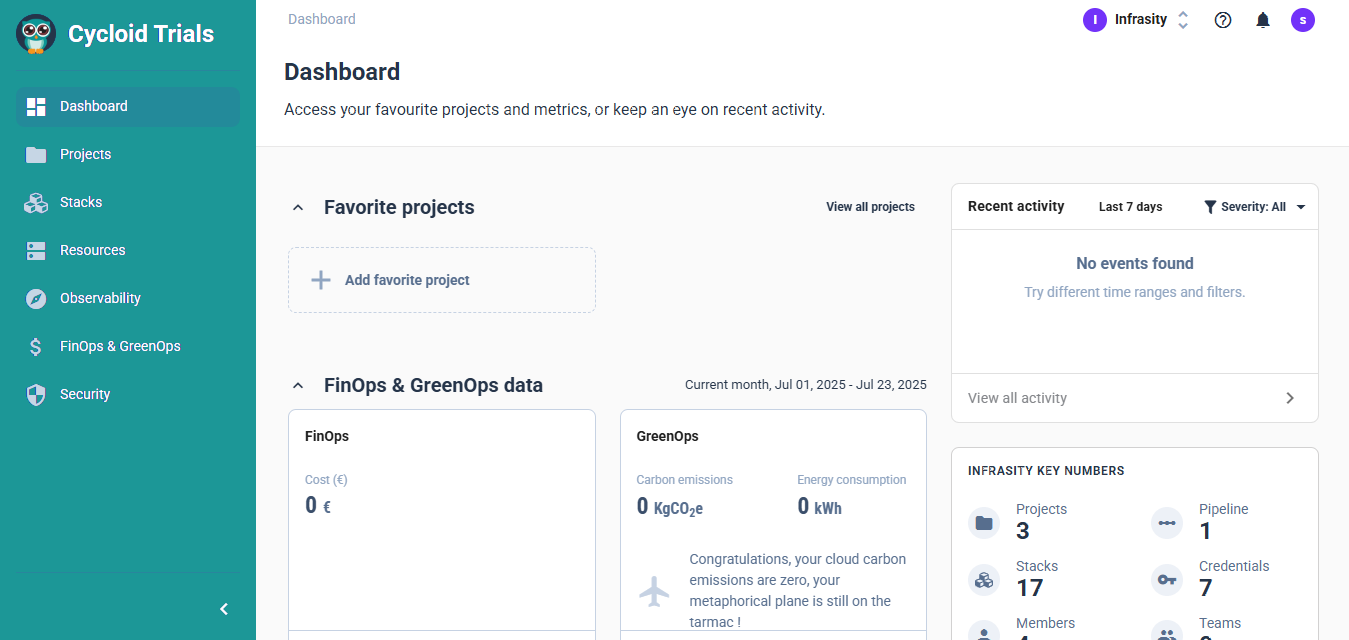
Cycloid includes cloud cost estimation tools before provisioning even begins, and integrates usage tracking and carbon footprint analysis post-deploy. Teams can see how their Kubernetes clusters, VM instances, or managed services are consuming resources, and what that means in terms of dollars and carbon.
This goes beyond saving money. It’s about aligning engineering choices with business and sustainability goals. Why keep running unused instances? Why let workloads scale indefinitely without cost-aware constraints? FinOps brings cloud economics into the day-to-day decisions engineers make.
Day 2 Operations Checklist: 8 Core Tasks
This checklist provides a structured framework for implementing day 2 operations. Each task maps to a specific operational domain and can be adopted incrementally – start with the items that address your highest-risk gaps.
1. Monitoring and Alerting Setup
Define Service Level Indicators (SLIs) for every production service – latency, error rate, throughput, and saturation at minimum. Set alert thresholds based on SLOs, not arbitrary values. The 2025 DORA report found that AI adoption improves delivery throughput but still increases delivery instability, making monitoring more important rather than less (DORA, 2025). Use Cycloid’s InfraView to maintain a centralized visual map of infrastructure state across providers and projects.
2. Patch and Update Management
Establish a regular cadence for patching operating systems, container runtimes, Kubernetes control planes, and application dependencies. Track certificate expiry dates programmatically – not in spreadsheets. For Kubernetes clusters, plan minor version upgrades at least quarterly and test them in staging environments first. Automate vulnerability scanning in the CI/CD pipeline so patch urgency is data-driven.
3. Auto-Scaling Configuration
Configure Horizontal Pod Autoscalers (HPAs) and Vertical Pod Autoscalers (VPAs) based on observed traffic patterns, not Day 1 estimates. Review scaling policies quarterly against actual usage data. A misconfigured HPA is a common Day 2 failure that causes either cascading outages under load or unnecessary cost during low-traffic periods. Pair scaling configuration with cost governance to avoid runaway resource provisioning.
4. Incident Response Runbooks
Write runbooks for every production service. Each runbook should include: service owners, escalation paths, common failure modes and their mitigations, rollback procedures, and links to relevant dashboards and logs. Runbooks should live alongside the code in Git – not in a wiki nobody updates. Test runbooks during game day exercises at least quarterly.
5. Configuration Drift Detection and Remediation
Implement continuous drift detection that compares declared infrastructure state (Terraform state, Helm values, Kubernetes manifests) against actual state. 55% of cloud breaches trace back to configuration drift or oversight (DataStackHub, 2025). Cycloid’s InfraPolicies enforce policy-as-code rules that catch drift automatically, preventing manual changes from creating silent security vulnerabilities or compliance gaps.
6. Backup and Disaster Recovery Testing
Having backups is not enough – you need to test recovery. Schedule quarterly DR drills that validate recovery time objectives (RTOs) and recovery point objectives (RPOs) against actual performance. Test database restores, cross-region failover, and stateful workload recovery. Document recovery procedures and measure actual recovery time against targets.
7. Cloud Cost Governance
Implement tagging policies to attribute costs to teams, projects, and environments. Use resource scheduling to stop non-production environments outside business hours. Review rightsizing recommendations monthly. With $44.5 billion in cloud infrastructure projected wasted in 2025 (Harness, 2025), cost governance is an operational discipline, not a quarterly budget review. Cycloid’s FinOps modules integrate cost estimation, usage tracking, and carbon footprint analysis directly into the deployment pipeline.
8. Security Posture Continuous Validation
Run automated security scans against deployed infrastructure on a continuous basis – not just during deployment. Validate RBAC policies, network segmentation, encryption at rest and in transit, and secrets management. For Kubernetes environments, scan for pod security violations, privileged containers, and exposed services. Map scanning results to compliance frameworks (NIS2, DORA, SOC2) relevant to your organization.
Tools and Platforms Supporting Day 2 Operations
Day 2 isn’t solved by one tool, it’s a stack. Most teams rely on a combination of open-source and commercial platforms to manage observability, drift, and incident automation. Let’s look at how these tools fit into real operational workflows.
Monitoring and Observability
Prometheus is a staple for time-series metrics collection. When paired with Alertmanager, it supports threshold-based and templated alerting pipelines. For example, a latency breach in a critical endpoint can trigger an immediate alert, route it to PagerDuty, and also annotate a Grafana dashboard automatically.
Grafana (self-hosted or via Grafana Cloud) makes it easy to visualize multi-cluster Kubernetes metrics. Tools like Loki (for logs) and Tempo or OpenTelemetry (for traces) extend observability into full stack correlation. When deployed together, they reduce the mean time to detection significantly.
In larger setups, teams often use Cortex behind Grafana for horizontally scalable metric storage and cross-region observability, crucial in hybrid and multi-cloud environments.
Drift and Configuration Management
Even with full IaC, configuration drift creeps in. Someone makes a manual change in the cloud console, and now Terraform’s state diverges from reality. Platforms like Spacelift, Terraform Cloud, and Pulumi help maintain state integrity, enforce policies, and provide visibility.
A GitOps approach, using tools like ArgoCD, ensures infra definitions are always in sync with live environments. When divergence occurs, ArgoCD can flag it and optionally auto-reconcile. This is essential for repeatable, safe deployments.
On the policy enforcement side, Open Policy Agent (OPA) and HashiCorp Sentinel help declare and enforce infrastructure rules, like blocking public S3 buckets or enforcing tag compliance, directly in CI pipelines.
Automation and Incident Response
Ops automation is key when you’re aiming for resilience. PagerDuty and Opsgenie provide escalation management, runbooks, and SLO tracking for critical services. But alerts alone aren’t enough.
Tools like Rundeck enable incident responders to run predefined scripts, like restarting pods or isolating services, without SSH access. Combine this with Prometheus alerts and you get basic auto-remediation: a failing alert can invoke a webhook that restarts a deployment, kills rogue pods, or reverts a rollout, all without manual intervention.
| # prometheus.yml alerting: alertmanagers: – static_configs: – targets: – ‘alertmanager:9093’rule_files: – “alerts.yml”# alerts.yml groups: – name: example rules: – alert: HighErrorRate expr: rate(http_requests_total{status=~”5..”}[5m]) > 0.05 for: 1m labels: severity: critical annotations: summary: “High error rate detected” runbook: “https://runbooks.company.com/high-error-rate” |
Example Scenarios and Hands-On Patterns
Rather than list concepts, let’s walk through how Day 2 Ops unfolds in real-world workflows.
Kubernetes Day 2 Ops in Production
A production cluster hosting a multi-tenant SaaS needs to scale responsively while respecting tenant boundaries. HPA and VPA handle pod-level scaling based on CPU/memory or custom metrics. Meanwhile, Cluster Autoscaler adds or removes nodes to match workload demands.
To ensure smooth upgrades, Pod Disruption Budgets and RollingUpdate strategies are configured. For tenant isolation, RBAC is enforced at the namespace level, mapping roles to tenant-specific groups, avoiding noisy neighbor issues and securing inter-service access.
This setup requires continuous observability and policy enforcement, both of which tie back to Day 2 concerns.
Detecting and Fixing Drift in Terraform
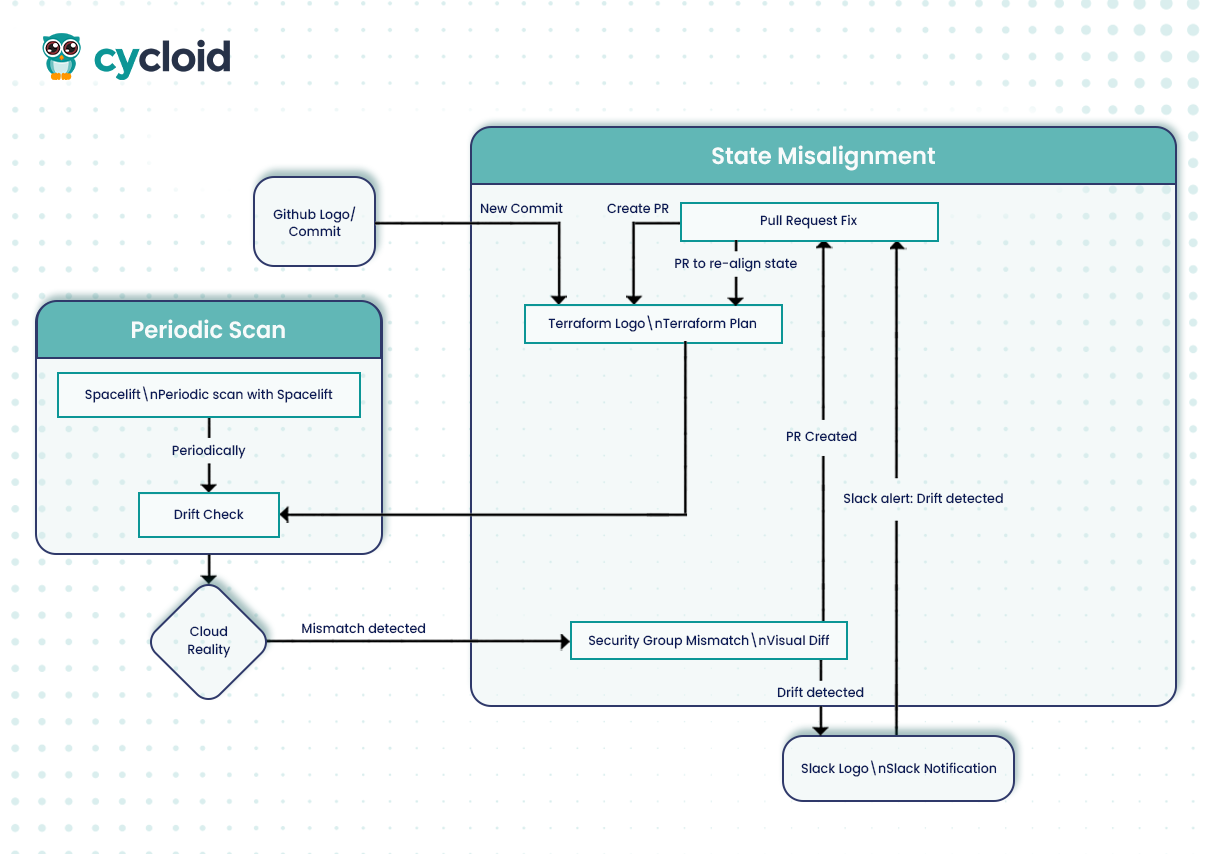
In this pattern, every commit triggers a terraform plan in CI. The output is diffed against state, and any unexpected change is flagged. With Spacelift integrated, drift detection happens periodically, even outside Git pushes.
When drift is detected (say, a modified security group via console), a notification is pushed to Slack. Engineers can review and re-align state via pull request, ensuring Git remains the source of truth.
This avoids shadow infra and secures auditability, critical for SOC2 or ISO compliance.
| # .github/workflows/terraform-plan.yaml – name: Terraform Plan run: terraform plan -no-color | tee plan.out – name: Check for Drift run: | if grep -q “Plan:” plan.out; then echo “Drift detected!” curl -X POST -H “Content-Type: application/json” \ -d ‘{“text”:”Drift detected in terraform plan!”}’ $SLACK_WEBHOOK_URL fi |
Self-Healing Deployment Pipeline
Consider a deployment pipeline that includes post-deploy health checks. If the app fails after rollout (e.g., readiness probes fail or traffic drops), a fallback plan triggers.
Using GitHub Actions with Argo Rollouts, you can run Canary deployments. If metrics degrade (via Prometheus queries), Argo halts the rollout, reverts to the stable version, and notifies the team. All of this happens automatically, turning incidents into recoverable blips instead of downtime.
| # rollout.yaml apiVersion: argoproj.io/v1alpha1 kind: Rollout metadata: name: my-app spec: replicas: 3 strategy: canary: steps: – setWeight: 25 – pause: {duration: 5m} – setWeight: 50 – pause: {duration: 5m} analysis: templates: – templateName: error-rate-check args: – name: error-rate value: “0.05” |
Common Pitfalls and How to Avoid Them
Day 2 operations are where things get messy fast, not because the architecture is broken, but because habits, tooling, and processes haven’t adapted post-deployment. Here are the most common traps teams fall into, and how to engineer your way out of them.
1. Over-alerting Without Context
In many teams, the first sign of a Day 2 maturity issue is an inbox flooded with alerts. CPU thresholds, disk usage warnings, pod restarts, all pinging at once. The problem isn’t the alerts, it’s what they lack: business context.
Instead of firing alerts based on raw metrics, define SLO-based alerts that focus on user-facing impact. Rather than “CPU > 90%,” consider “99th percentile latency > 500ms for 3 minutes.” That’s the difference between knowing your service is busy vs. knowing your users are affected.
Tie this into tools like Prometheus + Alertmanager, and define labels for severity, runbook links, and ownership. Most importantly, prune aggressively. If an alert hasn’t led to action in 3 months, it’s probably noise.
2. Configuration Sprawl
The beauty of infrastructure-as-code can turn ugly when duplicated, diverged, and unmanaged. Teams copy-paste Terraform modules, Kubernetes manifests, or Helm charts across environments. When one needs a fix, five versions must be updated manually. This is configuration sprawl.
To prevent this, centralize your templates and modules, and version them. Tools like Cycloid’s Stacks and StackForms allow teams to reuse pre-validated infra blocks while still enabling customization per environment. Think of it like shared UI components, the logic is reused, but the implementation stays flexible.
The result? Fewer snowflake environments, less manual patching, and stronger infra consistency across teams.
3. Runbooks that Stay in Docs
Most teams have runbooks, Google Docs or Notion pages with titles like “How to restart a service if X fails.” But during a 2AM incident, no one wants to grep through docs. The better approach is to codify known recovery actions into scripts or workflows.
Use tools like Rundeck or Cycloid-integrated automation hooks to build pre-approved, parameterized scripts. These can be triggered manually or automatically via alerts. For example: “If disk usage > 90%, run cleanup script on volume group.”
By turning docs into executable automation, you eliminate tribal knowledge and reduce time-to-recovery, even for junior engineers or new hires.
Conclusion
Day 2 operations are the difference between software that ships and software that survives. They’re not glamorous, no demo ever features config drift detection or alert fatigue recovery, but they’re where platform maturity shows. Day 2 Ops require a mindset shift: from “did we deploy it?” to “is it operating well every day, for every team, in every environment?”
That means baking in observability from the start. It means automating the predictable, alerting on what matters, and designing infrastructure for continuous evolution, not static snapshots.
As infrastructure grows in complexity, Day 2 readiness becomes your engineering org’s defensive architecture, the stuff that keeps systems reliable when complexity, scale, and time are working against you. And in platforms like Cycloid, you have a toolset built specifically to tame that complexity, bringing GitOps, FinOps, observability, automation, and policy into one controllable surface.
FAQs
1. What are day 2 operations?
Day 2 operations are the ongoing post-deployment tasks required to keep infrastructure running reliably. They include monitoring and alerting, patch management, auto-scaling, incident response, configuration drift detection, backup and disaster recovery, cloud cost governance, and security posture validation. In the day 0/1/2 model, day 2 represents the longest and most resource-intensive phase – where platform teams spend the majority of their time after initial deployment is complete.
2. What is the difference between day 0, day 1, and day 2 operations?
Day 0 is design and planning: architecture decisions, IaC templates, compliance policies, and identity strategy. Day 1 is deployment and execution: provisioning infrastructure, running CI/CD pipelines, and deploying services into production. Day 2 is sustained operations: monitoring, patching, scaling, incident response, drift detection, and cost governance. The key distinction is that day 0 and day 1 are time-bounded phases, while day 2 is ongoing and open-ended – it lasts the entire lifetime of the infrastructure.
3. How do you implement day 2 operations in platform engineering?
Implementing day 2 operations in platform engineering starts with embedding operational concerns into the platform itself rather than leaving them to individual teams. This means building golden paths that include monitoring, alerting, and governance by default. An Internal Developer Platform like Cycloid automates day 2 tasks by integrating observability, drift detection via InfraPolicies, cost governance via FinOps modules, and asset visibility via InfraView – all within the same deployment pipeline used for day 1.
4. What are examples of day 2 operations tasks?
Common day 2 operations tasks include: setting up monitoring and alerting thresholds aligned to SLOs, managing patch cycles and version upgrades across environments, configuring horizontal and vertical auto-scaling policies, writing and maintaining incident response runbooks, detecting and remediating configuration drift between declared and actual infrastructure state, testing backup and disaster recovery procedures, governing cloud costs through rightsizing and resource scheduling, and continuously validating security posture against compliance frameworks.
5. Why are day 2 operations important for Kubernetes?
Kubernetes amplifies day 2 complexity because it introduces a dense layer of abstractions – pods, services, ingress controllers, HPAs, network policies – each requiring ongoing configuration, monitoring, and lifecycle management. A single misconfigured HorizontalPodAutoscaler can cause cascading failures under load. Kubernetes clusters also demand continuous upgrades, certificate rotation, and RBAC policy maintenance. Platform engineering teams use IDPs to standardize these day 2 tasks across clusters, embedding observability and governance into deployment templates so individual teams do not need to solve these problems independently.
Take Control of Day 2 Operations
Day 2 operations are where infrastructure investments succeed or fail. The deployment pipeline handles Day 1. The platform handles Day 2.
See how Cycloid automates day 2 operations – from drift detection and cost governance to self-service infrastructure with built-in guardrails. Visit the platform engineering page.
Book a demo to see the Internal Developer Platform in action – including InfraView, InfraPolicies, FinOps modules, and StackForms self-service.