








 By the Cycloid Platform Engineering team. Originally published by Snezhanna Markova, 7 February 2023 — updated Q1 2026 with an expanded metrics list and DORA 2024 benchmarks.
Originally published 7 February 2023 · Q1 2026 update by the Cycloid Platform Engineering team
Last updated: Q1 2026 – Metrics list expanded, DORA 2024 benchmarks added.
Platform engineering metrics are quantitative indicators used to measure the effectiveness of an Internal Developer Platform and the productivity of the teams it supports. They cover four dimensions: delivery performance (DORA metrics: Deployment Frequency, Lead Time, MTTR, Change Failure Rate), developer experience (onboarding time, cognitive load, satisfaction), platform adoption (active users / total developers), and business impact (incident reduction, sprint velocity). Together, they give platform teams the evidence needed to justify IDP investment to engineering leadership.
Platform engineering metrics are the bridge between developer experience and business outcomes. Here are the 10 metrics every platform team should track in 2026, grouped across the four dimensions above and benchmarked against the DORA 2024 State of DevOps Report. This guide expands the original seven KPIs we published in 2023 into the ten metrics that hold up under a 2026 evaluation.
Platform engineering is a mainstream approach to software delivery in 2026: Gartner expects 80% of large software engineering organisations to have dedicated platform teams by end of year, and DORA’s 2025 report puts adoption at 90%. It also warns that fewer than 30% will demonstrate measurable productivity gains without deliberate measurement. This list is how you become one of them.
Key Goals of Platform Engineering (Preserved from 2023, Validated for 2026)
When setting up your success metrics, keep sight of what a platform engineering strategy should aim for. The DORA 2025 State of DevOps confirms the top goals engineering leaders set for their platform teams: enabling developer autonomy, accelerating iteration speed, embedding security processes, and creating measurable cost accountability.
Educating and empowering developer and product teams remains a major priority for platform teams, followed by iteration speed and security processes. This people-centric approach is the one you should adopt in your metrics. Reinventing tools is only half the job – you need to make sure your people are comfortable using the new frameworks. Streamlining and automating processes according to DevX best practices helps the entire organisation move more quickly and drive a competitive edge.
The 4 Dimensions of Platform Engineering Metrics
A modern metrics framework covers four dimensions. Skipping any one leaves you unable to answer a question leadership will ask.
- Delivery performance (DORA). How fast and reliably teams ship software.
- Developer experience (SPACE). Whether developers can do their best work on the platform.
- Platform adoption. Whether the IDP is being used across the engineering organisation.
- Business impact. Whether the platform investment produces measurable ROI.
Metrics 1-4: DORA Delivery Performance
The four DORA metrics are the industry-standard measure of software delivery. Every platform team’s dashboard should start here.
1. Deployment FrequencyDORA
How often the team deploys code to production. High frequency is a proxy for the team’s ability to make small, safe changes with confidence. It reflects investment in CI/CD, environment automation, and test coverage.
How to measure: count production deployments per team per unit of time (day, week).
2024 DORA benchmark: Elite = on-demand (multiple deploys per day), High = between once per day and once per week, Medium = between once per week and once per month, Low = less than once per month.
2. Lead Time for ChangesDORA
Time from a code commit to that code running in production. A low lead time signals a well-oiled CI/CD pipeline, a small backlog, and confident deploys. High lead time signals a roadblock somewhere – approval bottlenecks, slow tests, or manual handoffs.
How to measure: median time from commit merged to production deploy.
2024 DORA benchmark: Elite = less than one hour, High = less than one day, Medium = one day to one week, Low = more than one week.
3. Change Failure Rate (CFR)DORA
The percentage of deployments that cause a failure in production (rollback, hotfix, incident). CFR is the reliability side of the “ship fast” equation. Above 15% indicates the team is spending too much time fixing what shouldn’t have shipped.
How to measure: deployments causing failures divided by total deployments.
2024 DORA benchmark: Elite = 0-15%, High = 16-30%, Medium = 16-30%, Low = 46-60%.
4. Mean Time to Recover (MTTR)DORA
How long a service takes to resume normal operation after an interruption. Even the best DevOps teams experience unanticipated downtime – MTTR measures whether the platform helps them recover fast. See our InfraView for infrastructure observability for real-time incident context.
How to measure: median time from incident detection to service restored.
2024 DORA benchmark: Elite = less than one hour, High = less than one day, Medium = one day to one week, Low = more than one week.
DORA 2024 Benchmark Table
Use this to score your team against the industry cohorts.
| Metric | Elite | High | Medium | Low |
| Deployment Frequency | On-demand (multiple / day) | Daily to weekly | Weekly to monthly | < Once per month |
| Lead Time for Changes | < 1 hour | < 1 day | 1 day to 1 week | > 1 week |
| Change Failure Rate | 0-15% | 16-30% | 16-30% | 46-60% |
| MTTR | < 1 hour | < 1 day | 1 day to 1 week | > 1 week |
Source: DORA 2024 State of DevOps Report. Benchmarks refreshed annually.
Metrics 5-8: Developer Experience (SPACE Framework)
DORA measures the outputs of a healthy engineering system. The SPACE framework – Satisfaction, Performance, Activity, Communication, Efficiency – measures the humans producing those outputs. Four SPACE-aligned metrics cover the developer experience layer.
5. Developer Satisfaction / Platform NPSSPACE
Regular pulse-check on whether developers actually enjoy using the platform. Net Promoter Score works well: “How likely are you to recommend this platform to another engineer?” A rising NPS is one of the strongest leading indicators of successful platform adoption.
How to measure: quarterly survey, tracked as a trend rather than an absolute.
6. Onboarding Time (Time to First Commit)SPACE
How long from a new engineer’s start date to their first merged production commit. This is the single most-cited business case for an IDP: a mature platform cuts onboarding from weeks to days. It also correlates strongly with retention – engineers who feel productive early stay longer.
How to measure: median days from start date to first merged PR.
7. Platform Adoption Rate
The ratio of active platform users to total developers in the organisation. A platform team can build the best IDP in the world, and if 20% of engineers use it, the ROI story falls apart. Adoption is the tell that the platform is actually solving the right problem.
How to measure: monthly active platform users / total engineers, tracked over time.
8. Cognitive Load IndexSPACE
Qualitative measure of how much mental effort developers spend on non-product work: understanding tooling, waiting for approvals, chasing information. Reducing cognitive load is one of the three pillars of platform engineering. The Team Topologies framework gives a good short survey.
How to measure: quarterly team survey, 5-question Likert scale.
Metrics 9-10: Business Impact
The two metrics that translate platform engineering into language the CFO understands.
9. Resource Allocation and Cost per Team
Platform engineering is about the efficient use of resources. Track cloud cost per engineering team, per project, and per environment. FinOps and GreenOps modules make this actionable rather than aspirational. See our FinOps solutions for the integration between platform metrics and cost accountability.
How to measure: monthly cloud spend broken down by team, project, and environment.
10. Self-Service Success Rate
The percentage of common infrastructure requests (new environment, database, service) that developers complete through the platform without opening a ticket. This is the direct measure of whether the platform is removing bottlenecks or just adding a UI on top of them.
How to measure: self-serviced requests / total infrastructure requests per month.
Platform Engineering KPI Dashboards
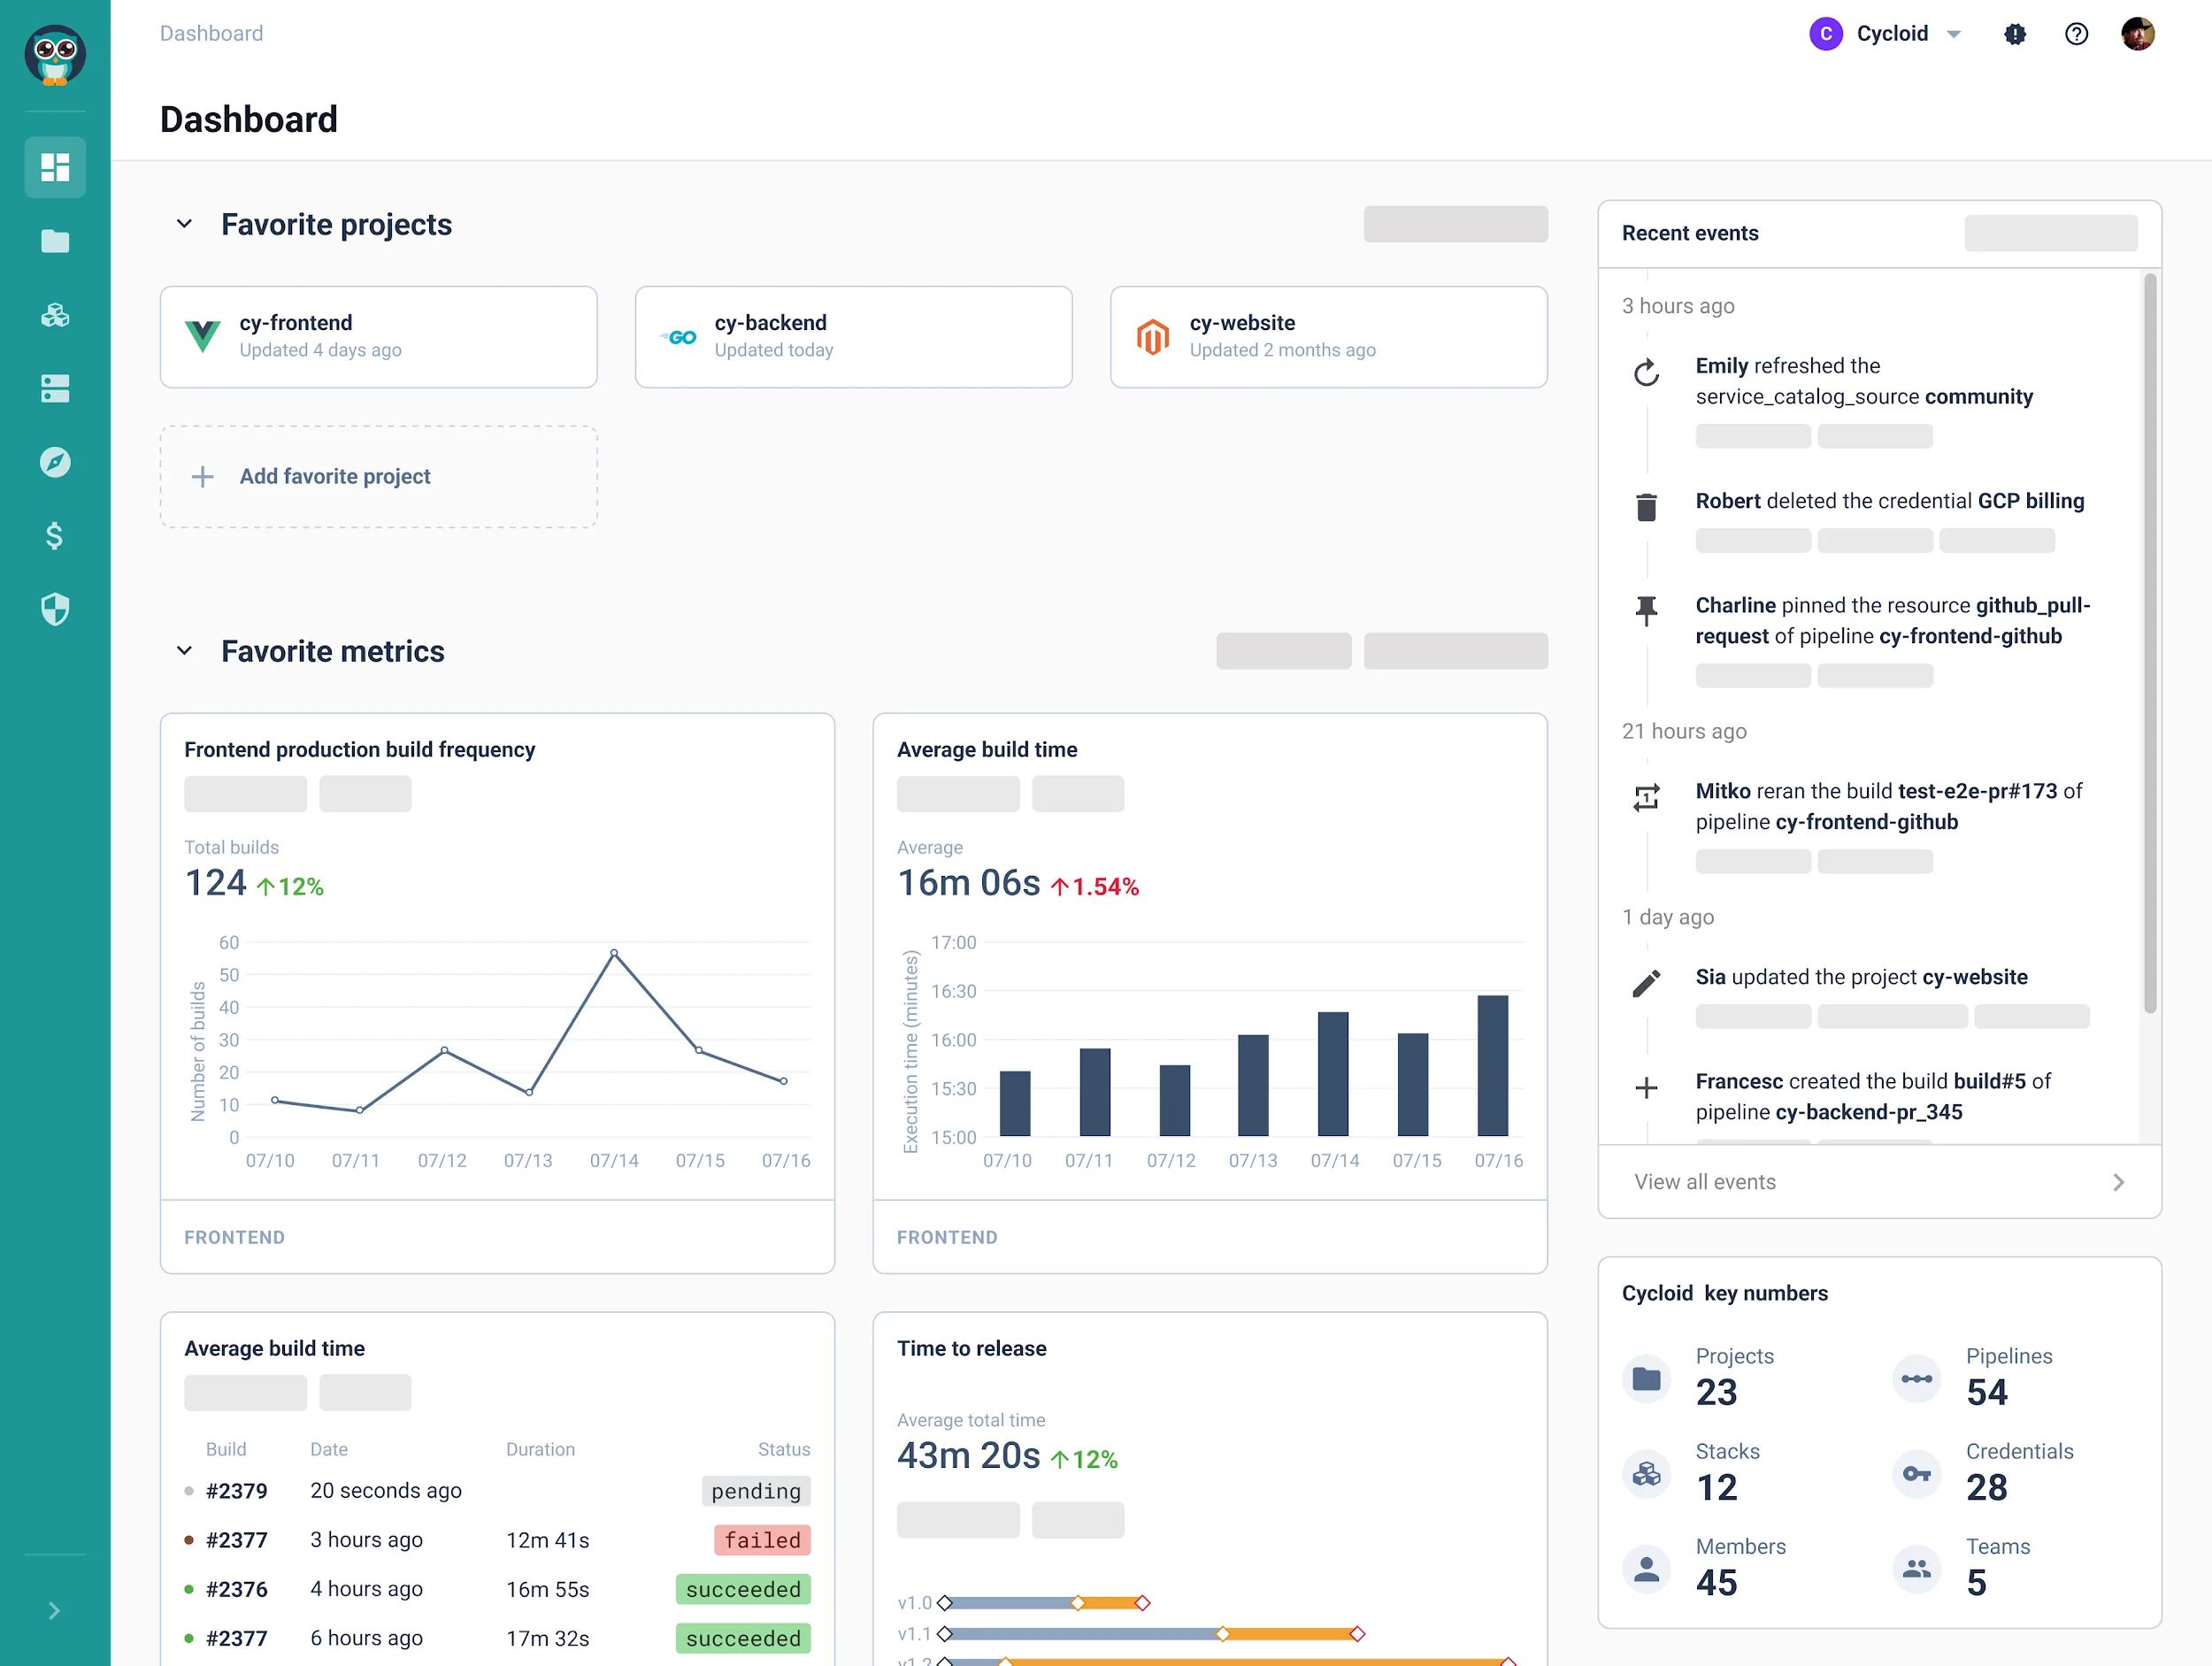
Many of these metrics have shared responsibility between teams – keep this in mind when visualising them. Transparency and observability are two of the things that break down team silos, so shared comprehensive KPI dashboards are worth the effort to build. Consider what KPIs look like at Cycloid:
Bottom Line: Set Realistic Expectations
A third of platform teams still struggle with wider-team resistance to platform adoption, so keeping an eye on your adoption progress belongs alongside your delivery KPIs. A platform benefits the whole company and brings teams to work closer together – that requires cooperation on all sides.
Whichever metrics you choose, set realistic expectations during the early years of platform team adoption. Your KPIs will evolve as you move through your platform engineering journey, but in the early stages, focus on making it much easier for platform and product teams to ingest their data and make it actionable. See our 2026 ranking of the best internal developer platforms for the tools that support these metrics natively.
FAQ
What are platform engineering metrics?
Platform engineering metrics are quantitative indicators used to measure the effectiveness of an Internal Developer Platform and the productivity of the teams it supports. They cover four dimensions: delivery performance (DORA metrics: Deployment Frequency, Lead Time, MTTR, Change Failure Rate), developer experience (onboarding time, cognitive load, satisfaction), platform adoption (active users / total developers), and business impact (incident reduction, sprint velocity). Together, they give platform teams the evidence needed to justify IDP investment to engineering leadership.
What is the difference between DORA metrics and platform engineering metrics?
DORA metrics (Deployment Frequency, Lead Time for Changes, MTTR, Change Failure Rate) measure software delivery performance. Platform engineering metrics are a broader superset that includes DORA plus developer experience (SPACE framework), platform adoption, and business impact. DORA answers whether teams deliver software fast and reliably; platform engineering metrics also answer whether the IDP is being used, whether developers are satisfied with it, and whether it is producing measurable ROI.
How do you measure developer platform success?
Measure platform success across four dimensions: (1) delivery performance via DORA metrics; (2) developer experience via satisfaction surveys and onboarding time; (3) platform adoption via the ratio of active platform users to total engineers; (4) business impact via incident reduction, sprint velocity, and cloud cost per team. Combine leading indicators (adoption, satisfaction) with lagging indicators (MTTR, change failure rate) to catch problems early and demonstrate value over time.
What KPIs should a platform team track in 2026?
The 10 platform engineering metrics to track in 2026 are: (1) Deployment Frequency; (2) Lead Time for Changes; (3) Change Failure Rate; (4) Mean Time to Recover; (5) Developer Satisfaction / Platform NPS; (6) Onboarding Time (time to first commit); (7) Platform Adoption Rate; (8) Cognitive Load Index; (9) Resource Allocation and Cost per Team; (10) Self-Service Success Rate. The first four are DORA; five through eight are developer experience; nine and ten are business and operational impact.
How do you prove the ROI of an internal developer platform?
Prove IDP ROI by measuring the same metrics before and after platform adoption: onboarding time (typically drops from weeks to days), lead time for changes (usually cut by 30-50% with self-service provisioning), platform team headcount saved (30-50% versus DIY builds per Forrester Total Economic Impact analyses), and cloud waste captured pre-deployment. The DORA 2025 report links high-quality internal platforms directly to organisations’ ability to capture value from AI coding tools – another measurable business impact.
Curious about Cycloid Platform Engineering? Get a personalised demo from our team.
Speak with our team