


Composable dashboards
Every view is panels. Every panel is yours.
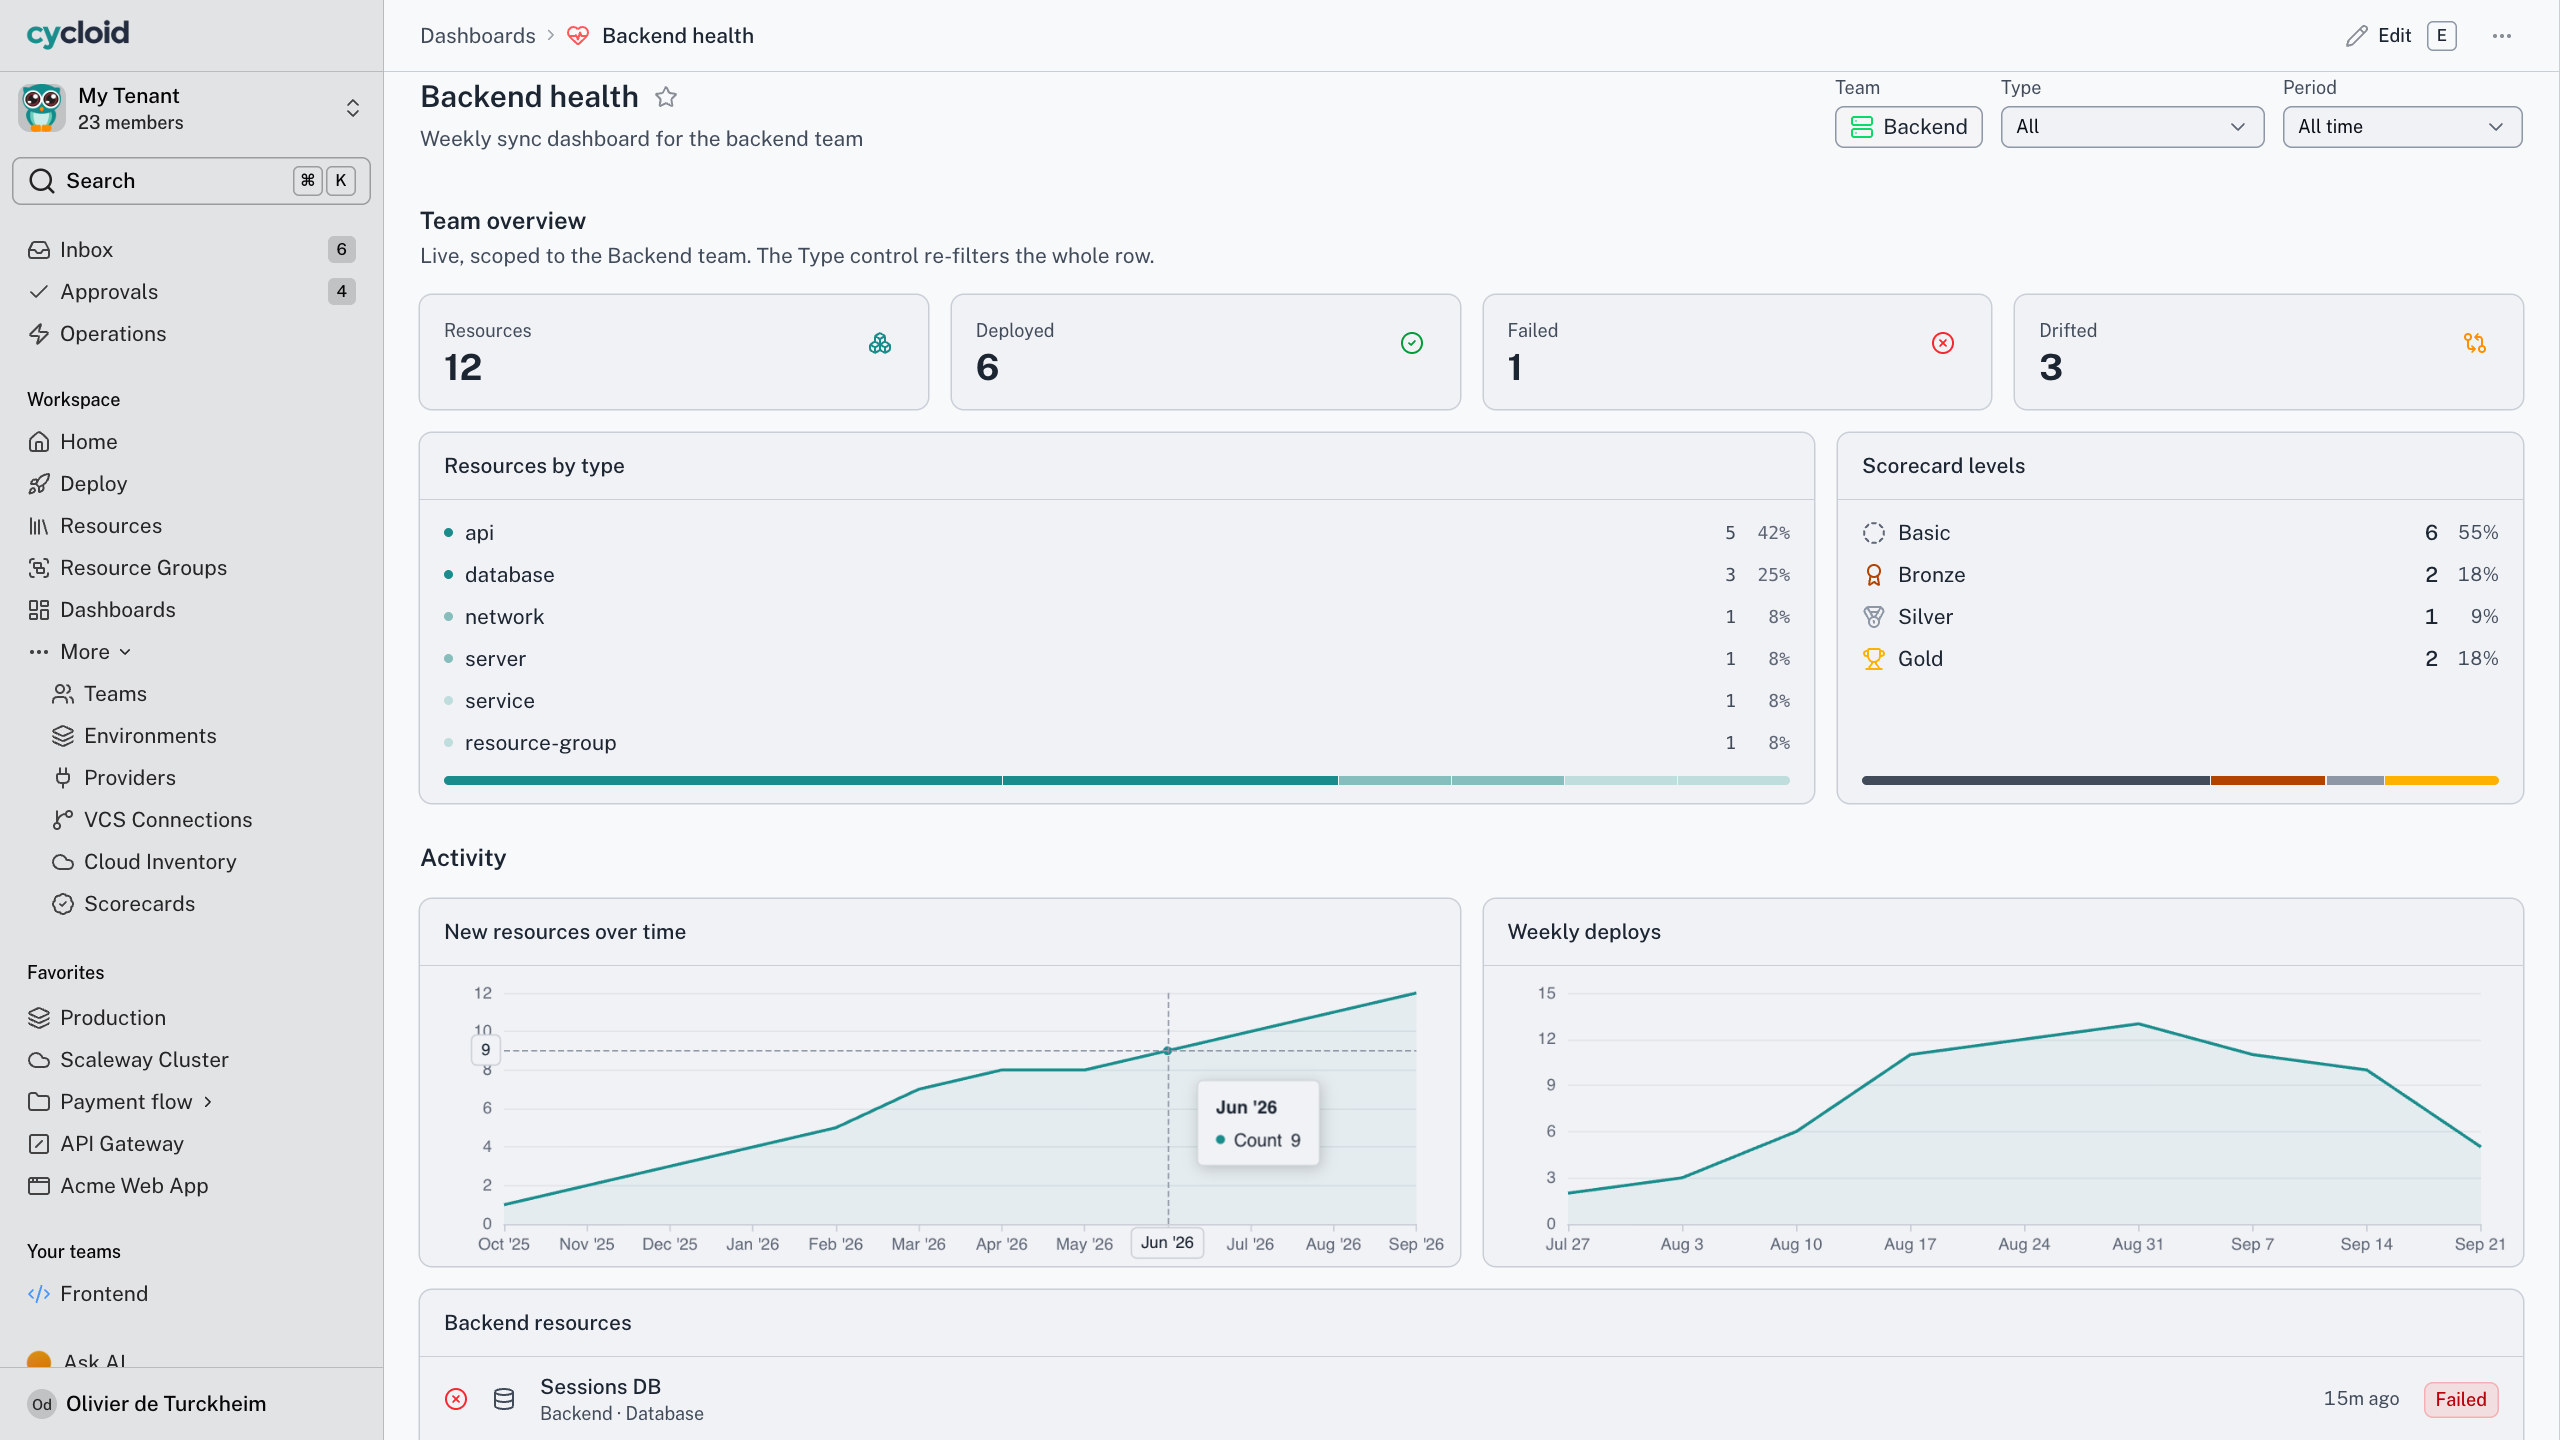
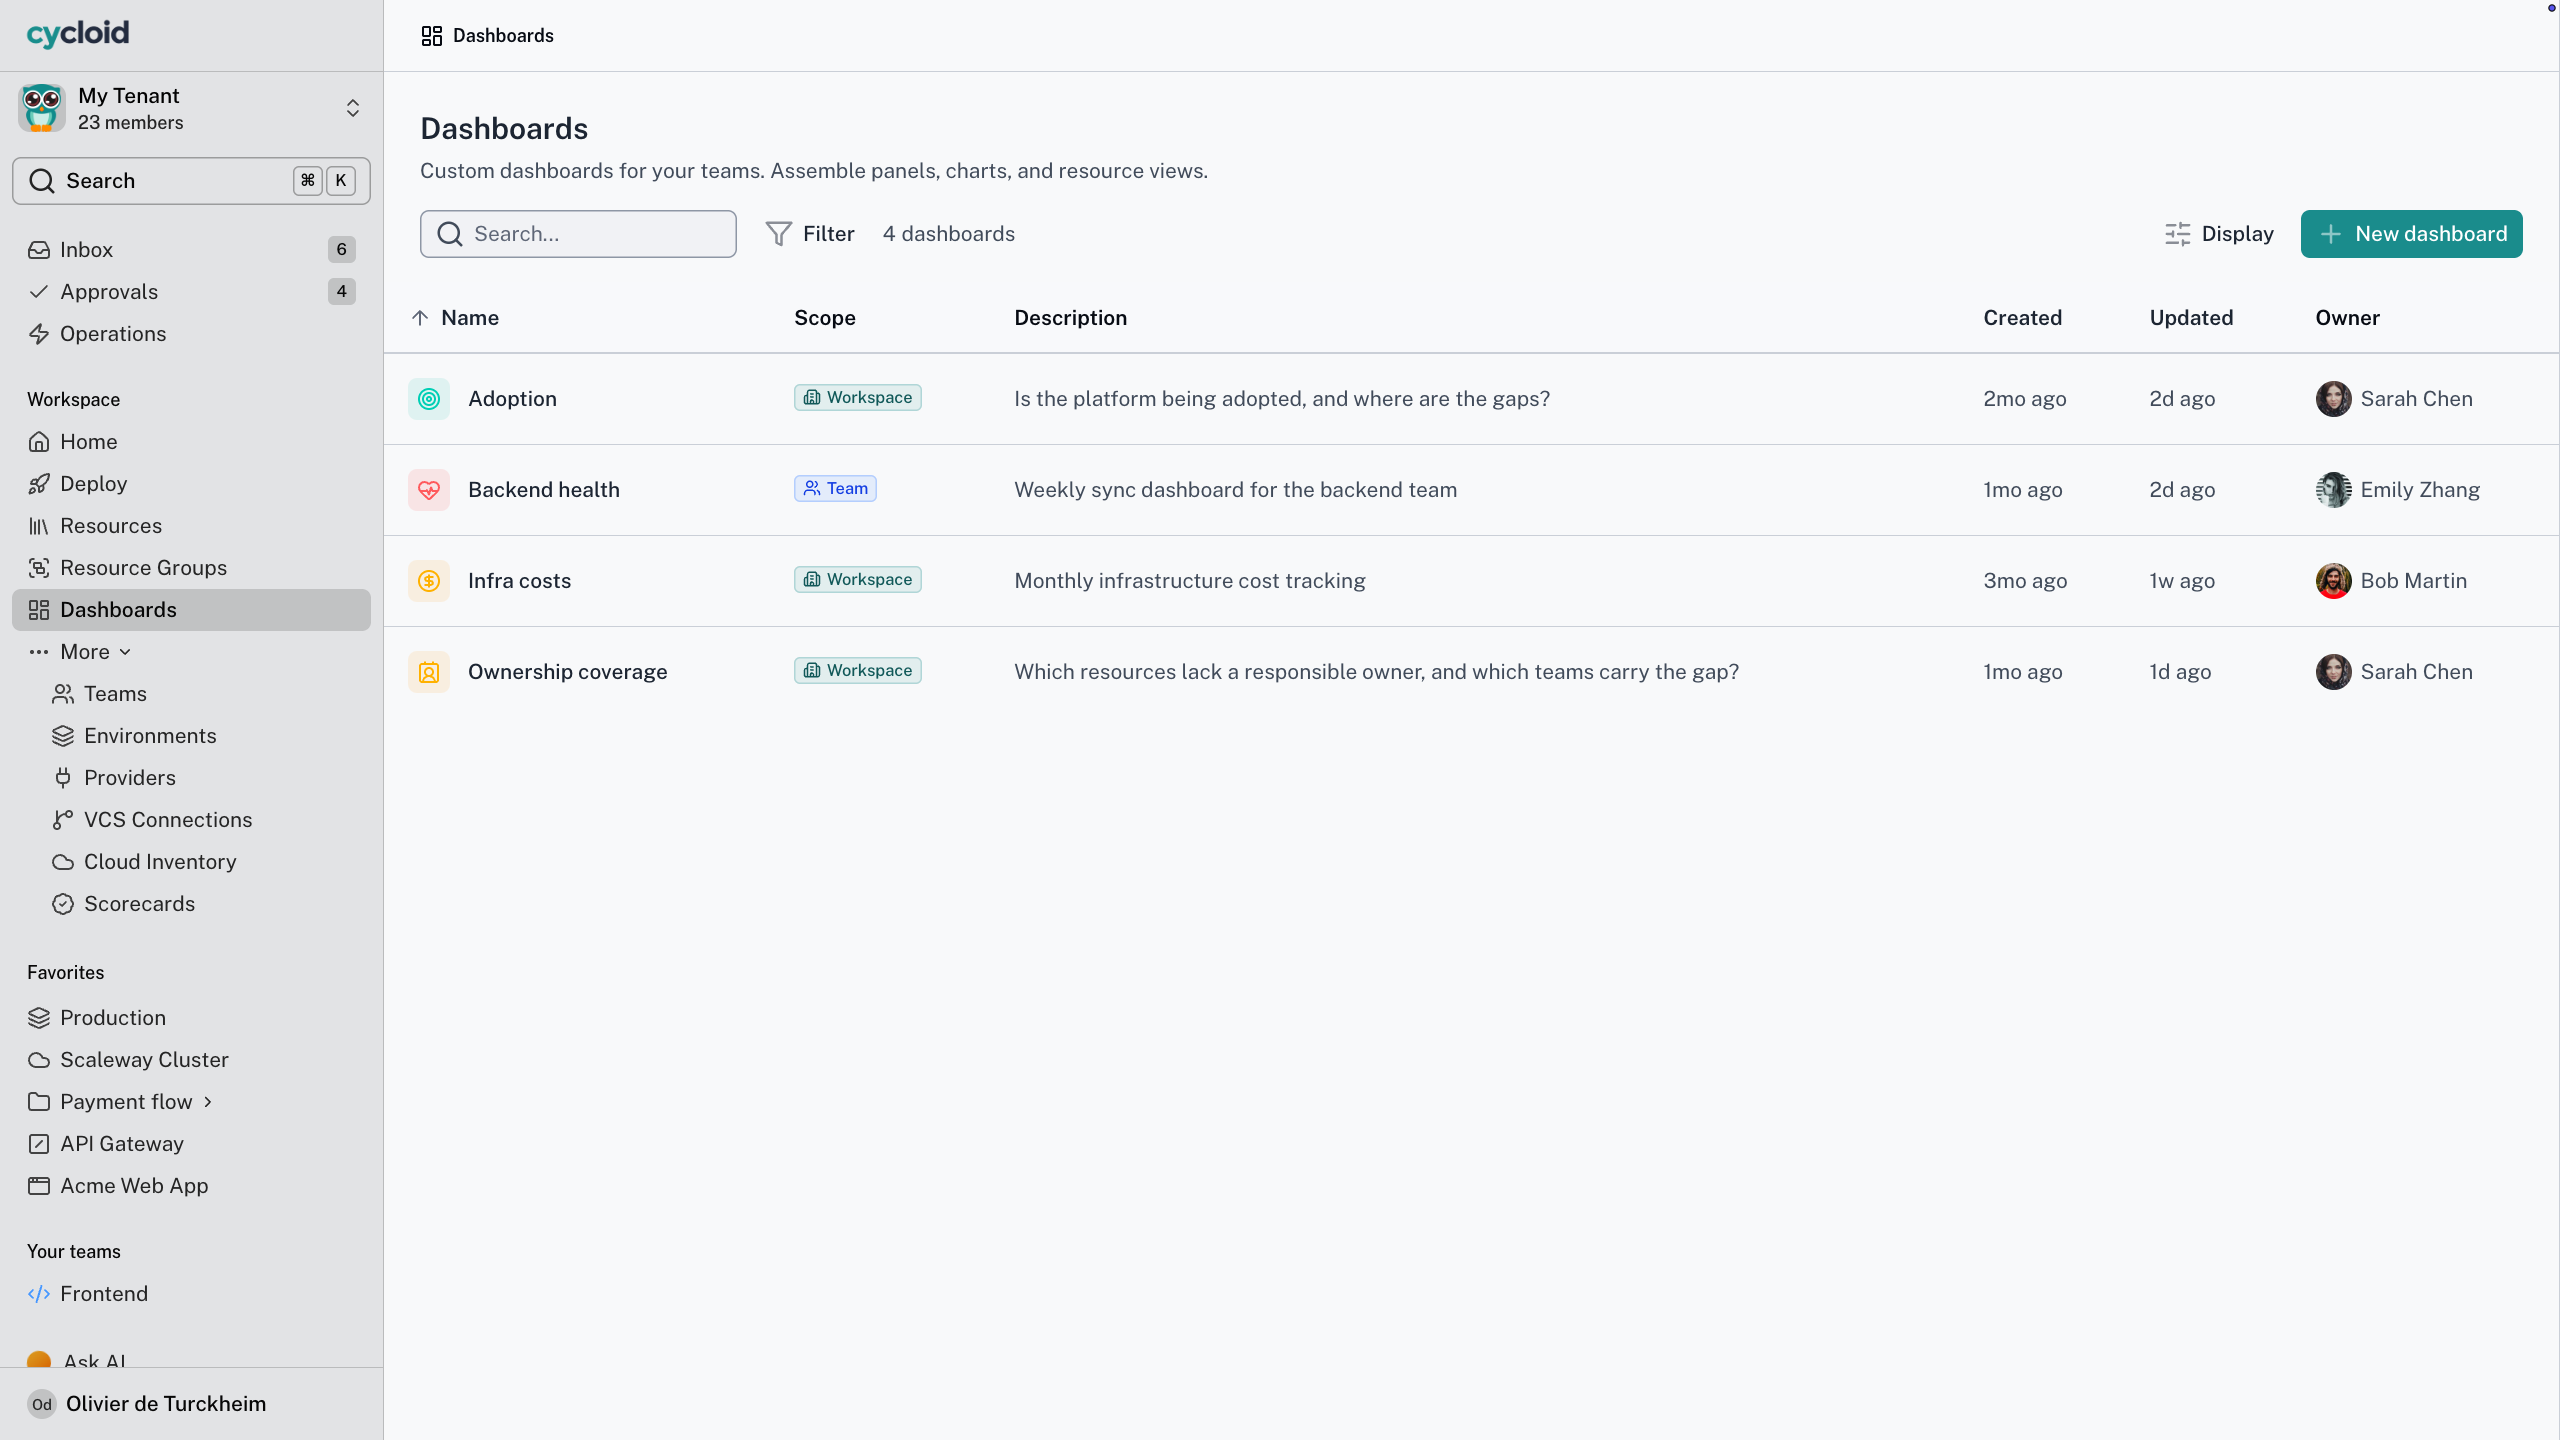
The adoption dashboard, team health, a resource’s overview tab. Each is panels on a grid, drawn from the same API you can query, so you can clone and edit any of them.
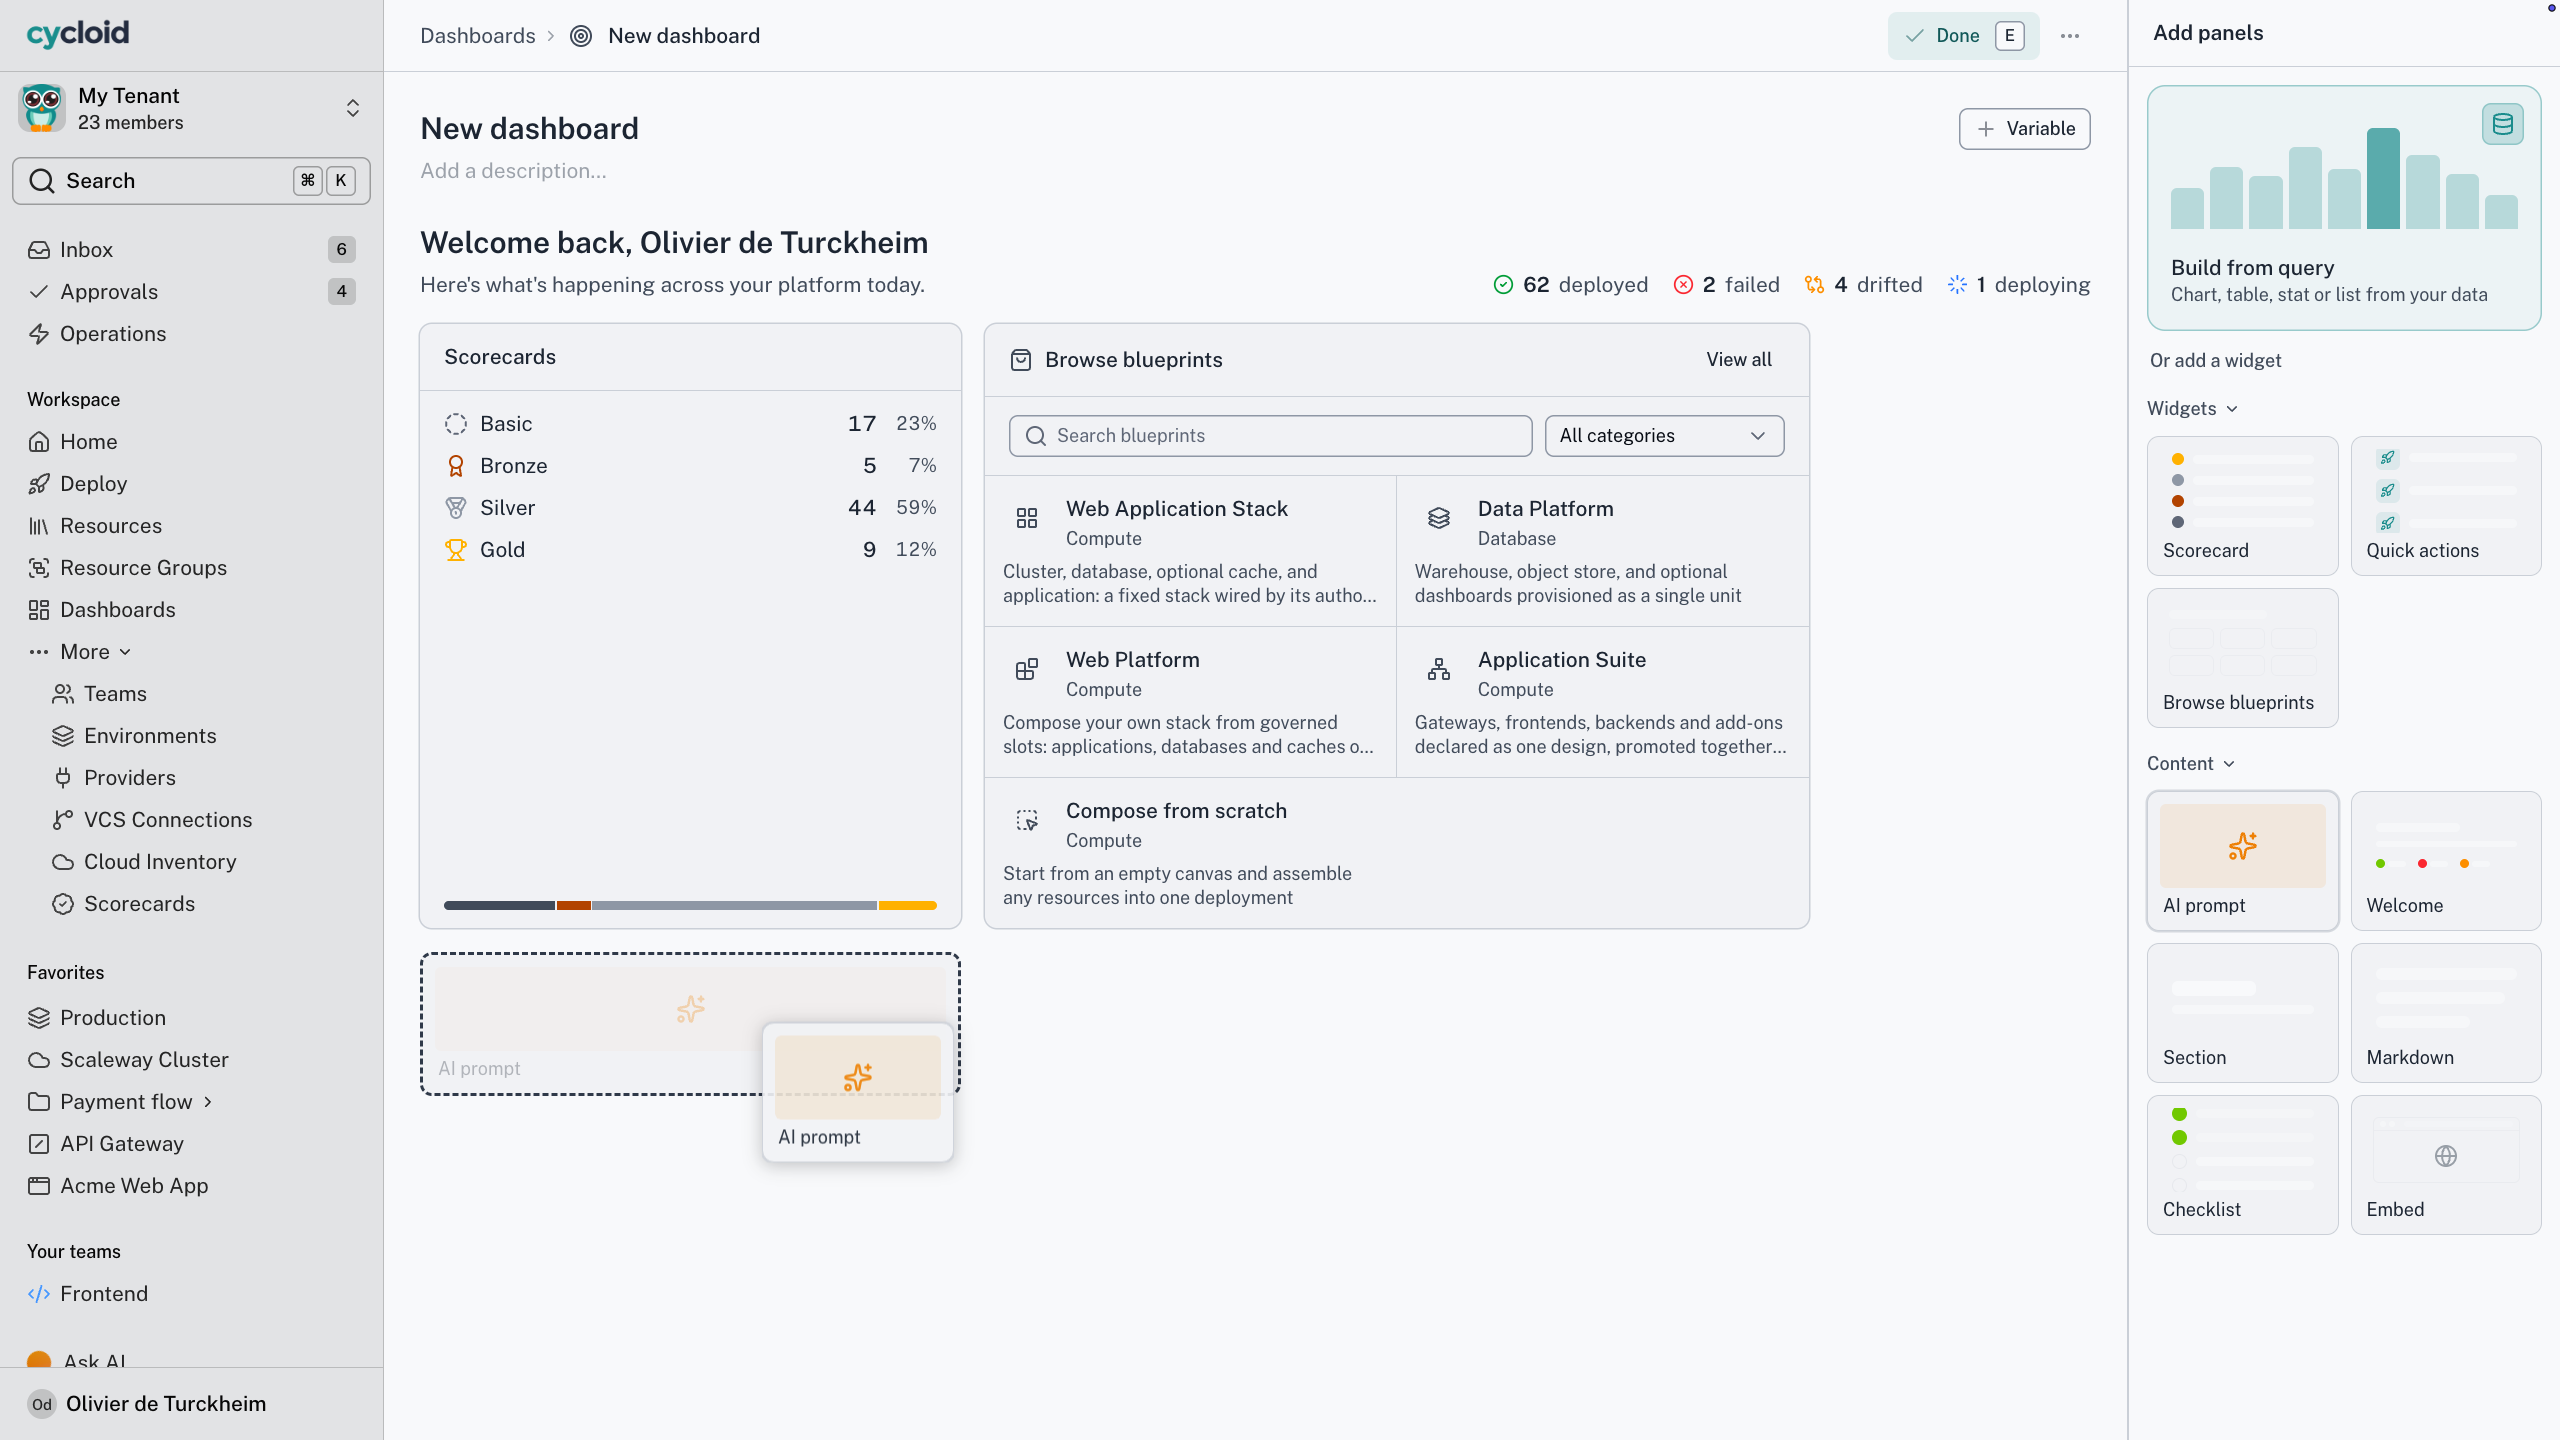
A dashboard in edit mode
Why fixed pages age badly
A fixed page fits about two teams
Your workspace home becomes a single pane of glass over the estate, built from the panels you choose. Every platform tool reaches the same fork. It either draws one page per context and hopes yours looks like the design, or it hands you a builder. A fixed page goes wrong in three ways.
One page, every team
Payments wants pending approvals at the top. SRE wants resource health. One layout has to lose one of them, and both teams learn to read around it.
The export
When the page won’t bend, the numbers go out to a reporting tool. Now they sit outside the permission model, and the copy is the one people argue about.
Two builders
A chart builder here, a page builder there. What you learn in one doesn’t transfer, and the two end up disagreeing about the same resource.
Cycloid for your team
What one engine means for each reader
Stop being the reporting team
The problem
Every team wants one more view, and each request lands on the people who least have time for it.
With Cycloid
Team Leads build their own team dashboards and portal pages. Tenant admins keep the tenant-wide pages and the sidebar.
The outcome
The requests that used to be tickets become edits somebody else makes.
One page for what you own
The problem
The answer to what you own and what’s broken lives three tools away from the place you’d act on it.
With Cycloid
A personal dashboard nobody else sees, your own home page, and action cards beside the data, so what you find is what you deploy.
The outcome
You change the page yourself.
Report on the platform from live data
The problem
Platform reporting means someone pasting numbers into a slide each month, a fortnight stale by the time anyone reads it.
With Cycloid
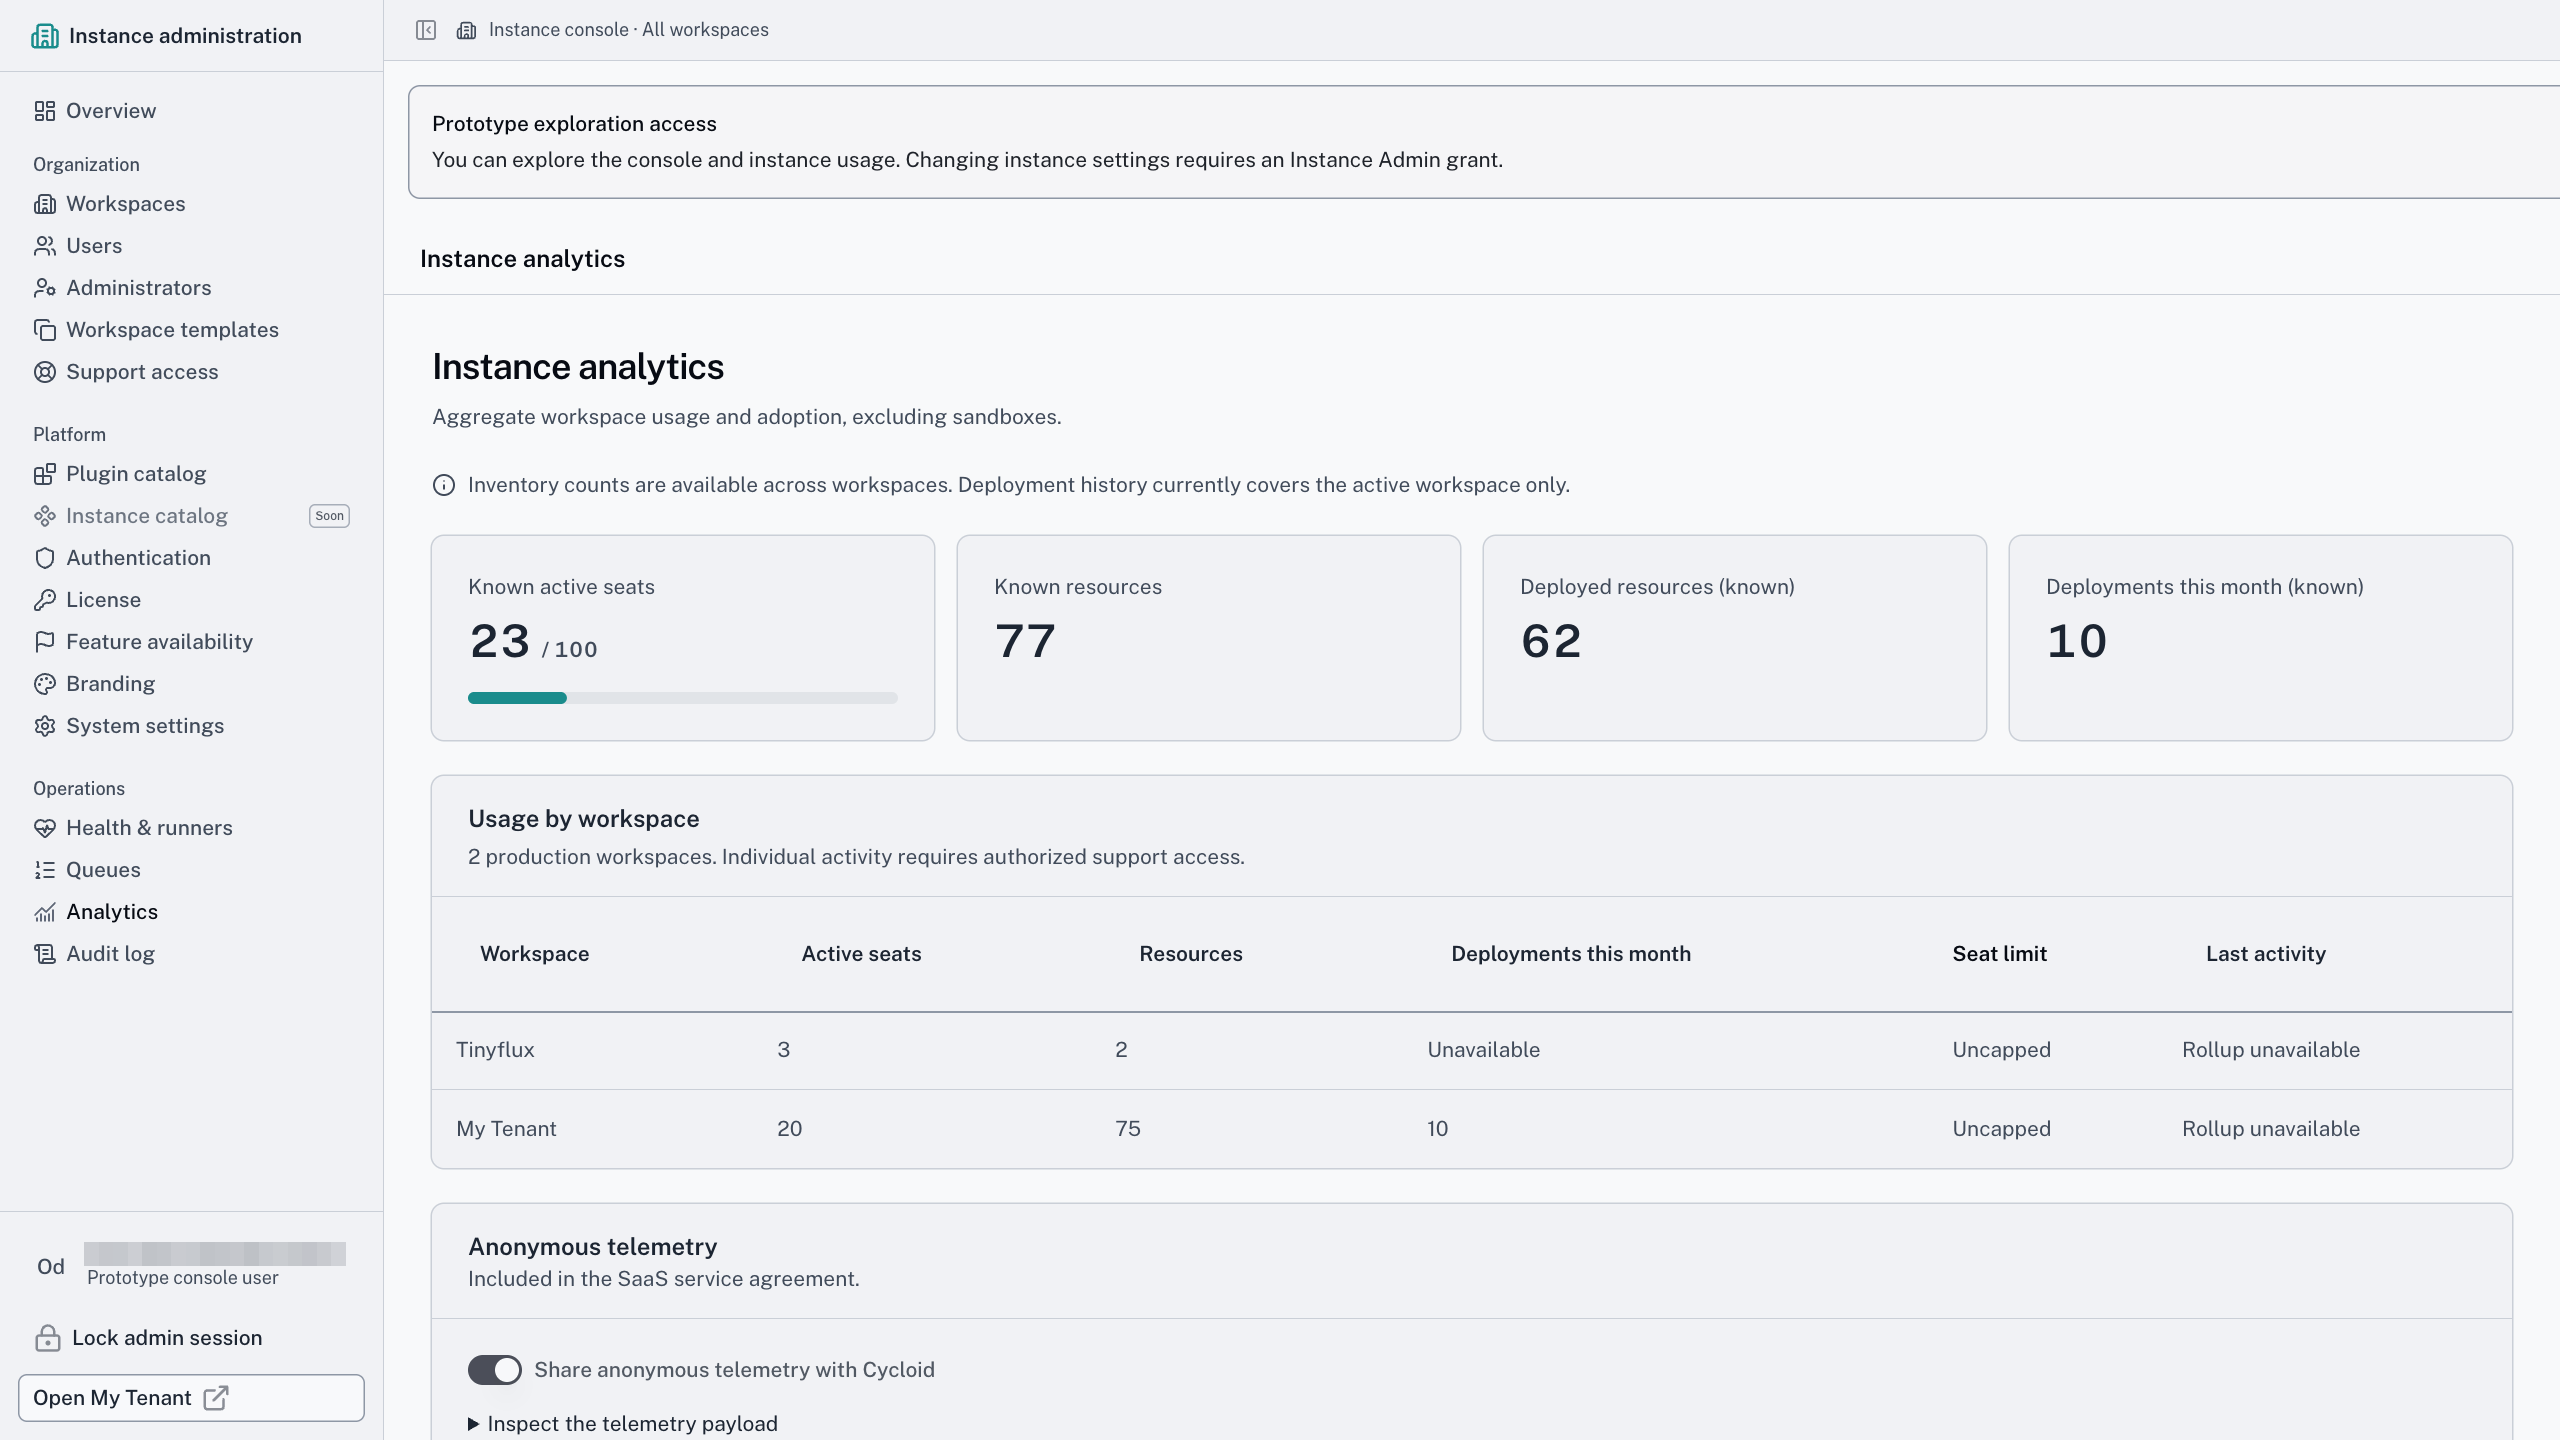
Adoption and executive summary templates at tenant scope, on live data, with per-team breakdowns visible across the tenant by default.
The outcome
The quarterly review reads the same page the platform team works from.
How it works
A panel is a query, a shape, and a place on the grid
01 · Choose the data
Resources, deployments, scorecards, teams, even a plugin’s pull requests. No GraphQL, and the builder follows relationships two levels deep.
02 · Filter and aggregate
Filter on team, status or environment, then count or group. A $team variable feeds every panel at once.
03 · Choose the shape
The builder reads the shape of your result and offers only the panel types that fit it. A table, a line chart, a health grid.
04 · Place it
Drag it onto a twelve-column grid. The last fifty versions are kept, so a change you regret on Friday is a revert on Monday.
05 · Share it without worrying
Queries run as the viewer, never the author. A panel reaching data you can’t see comes back empty.
It’s one engine everywhere. A portal page is a dashboard with a sidebar entry. A resource tab is a dashboard on a Blueprint, and the home page is one too. Learn the panel once and it works on all of them. Every query is priced before it runs, so one careless panel can’t take the page down.
A panel is a query, a shape, and a place on the grid
The short version
How far one engine goes
20+
panel types
6
places a dashboard can live
50
versions kept. Undo is always there
1
engine behind every view, ours included
Keep this month’s slowest-deploying teams as a dashboard for my team.

Cloned from the adoption template into your team’s scope, filters set. It’s yours to edit now.
Created · Platform adoption
Team scope
Created by
You, assistant named as actor
Readers
See it under their own permissions
Runs as you, no assistant role.
Working with your assistant
One question, and the dashboard you can keep
Does the assistant get its own permissions?
No. There’s no service account and no elevated assistant role. If you can’t deploy to production, neither can the assistant you’re talking to, in Cycloid’s own assistant or any compliant MCP host.
Ask which teams deployed least this month and your assistant runs the same query a panel would, under your permissions. You get an answer, not a screenshot of a page you then have to go and find.
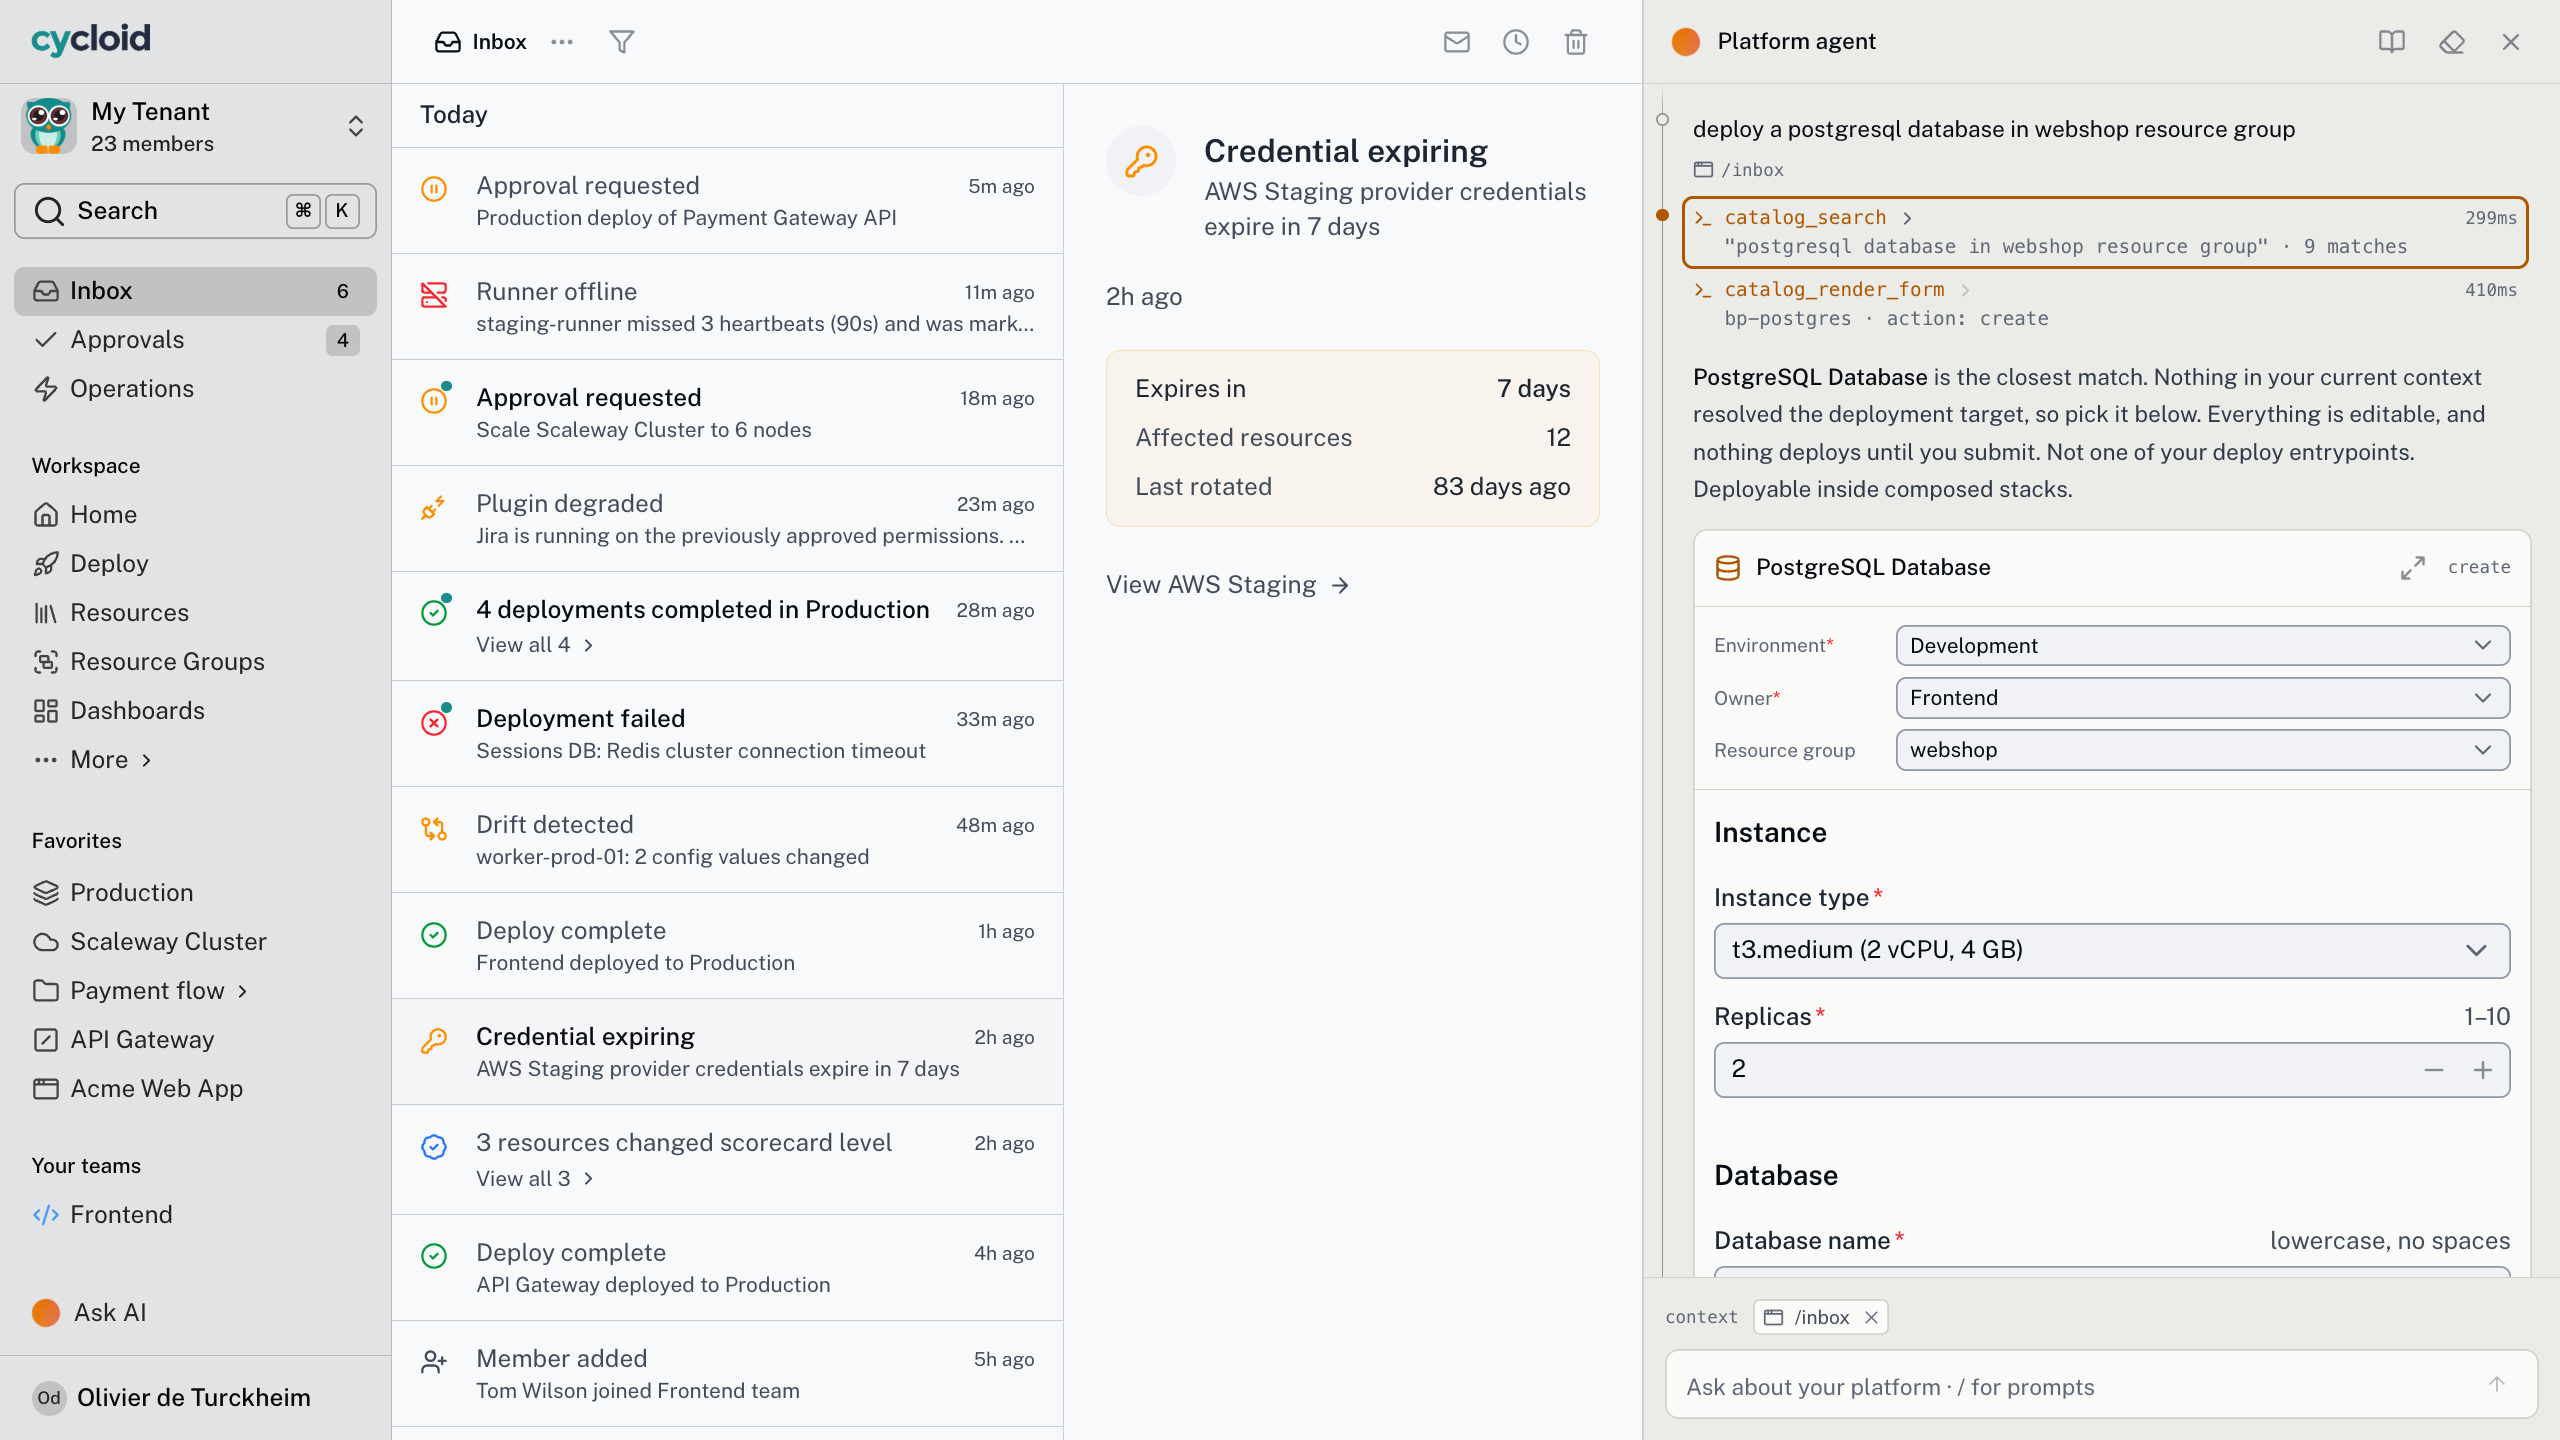
When it’s worth keeping, it clones the matching template into your team’s scope with the filters set, and hands you the link. From there it’s an ordinary dashboard you can edit.
Frequently asked questions
Anything the platform knows, including all four DORA metrics, drawn from deployment events you already produce. Lead time needs commit context from a VCS plugin. Without it the panel stays empty rather than guessing.
No. The visual builder writes the query, suggests the panel types that fit and follows relationships two levels deep. For anything further, promote the query into the raw editor and carry on there.
Yes, within their own scope. Anyone makes personal dashboards, Team Leads make team ones, and tenant admins own the tenant-wide pages. A good team page can be promoted to the whole tenant.
An untouched copy takes the update. An edited one shows what changed, panel by panel, for you to accept or skip. Panels you added yourself are never touched, and nothing we removed goes without your say.
See the view your team would actually use
Bring the dashboard someone rebuilds by hand every month. In twenty minutes we’ll build it as panels on live data, set it to your team’s scope, and hand it over for you to edit.