

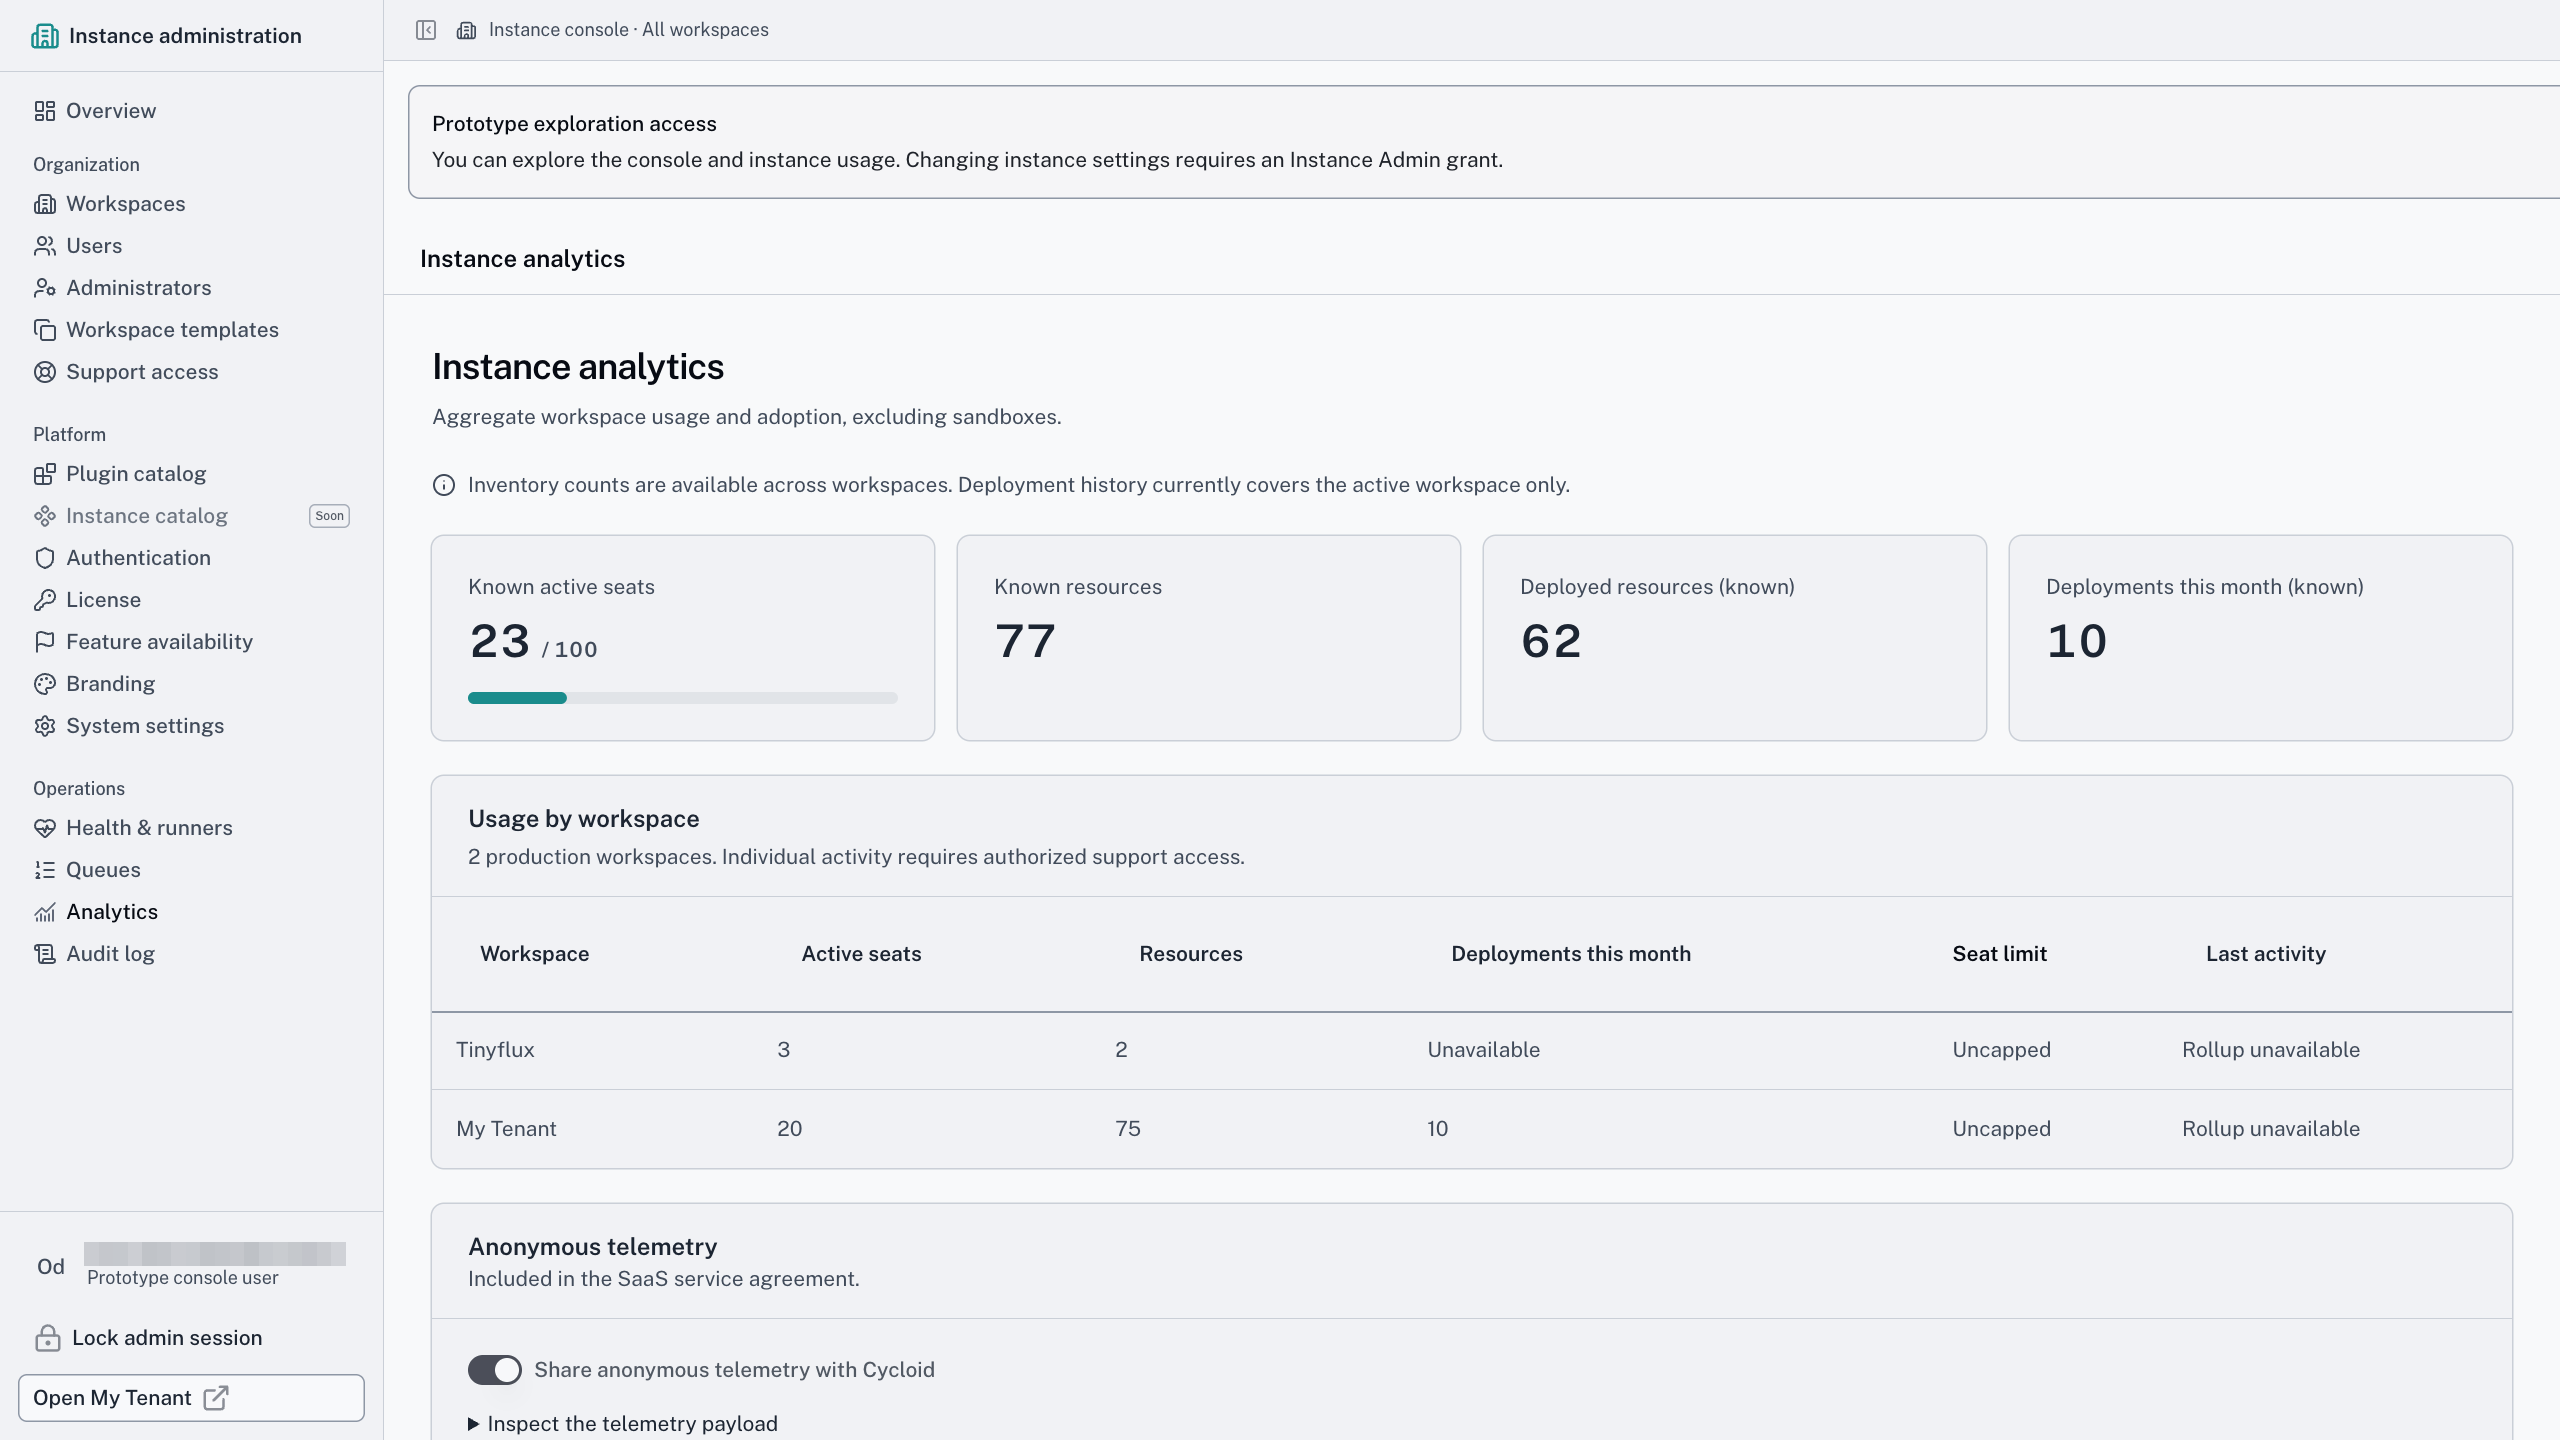
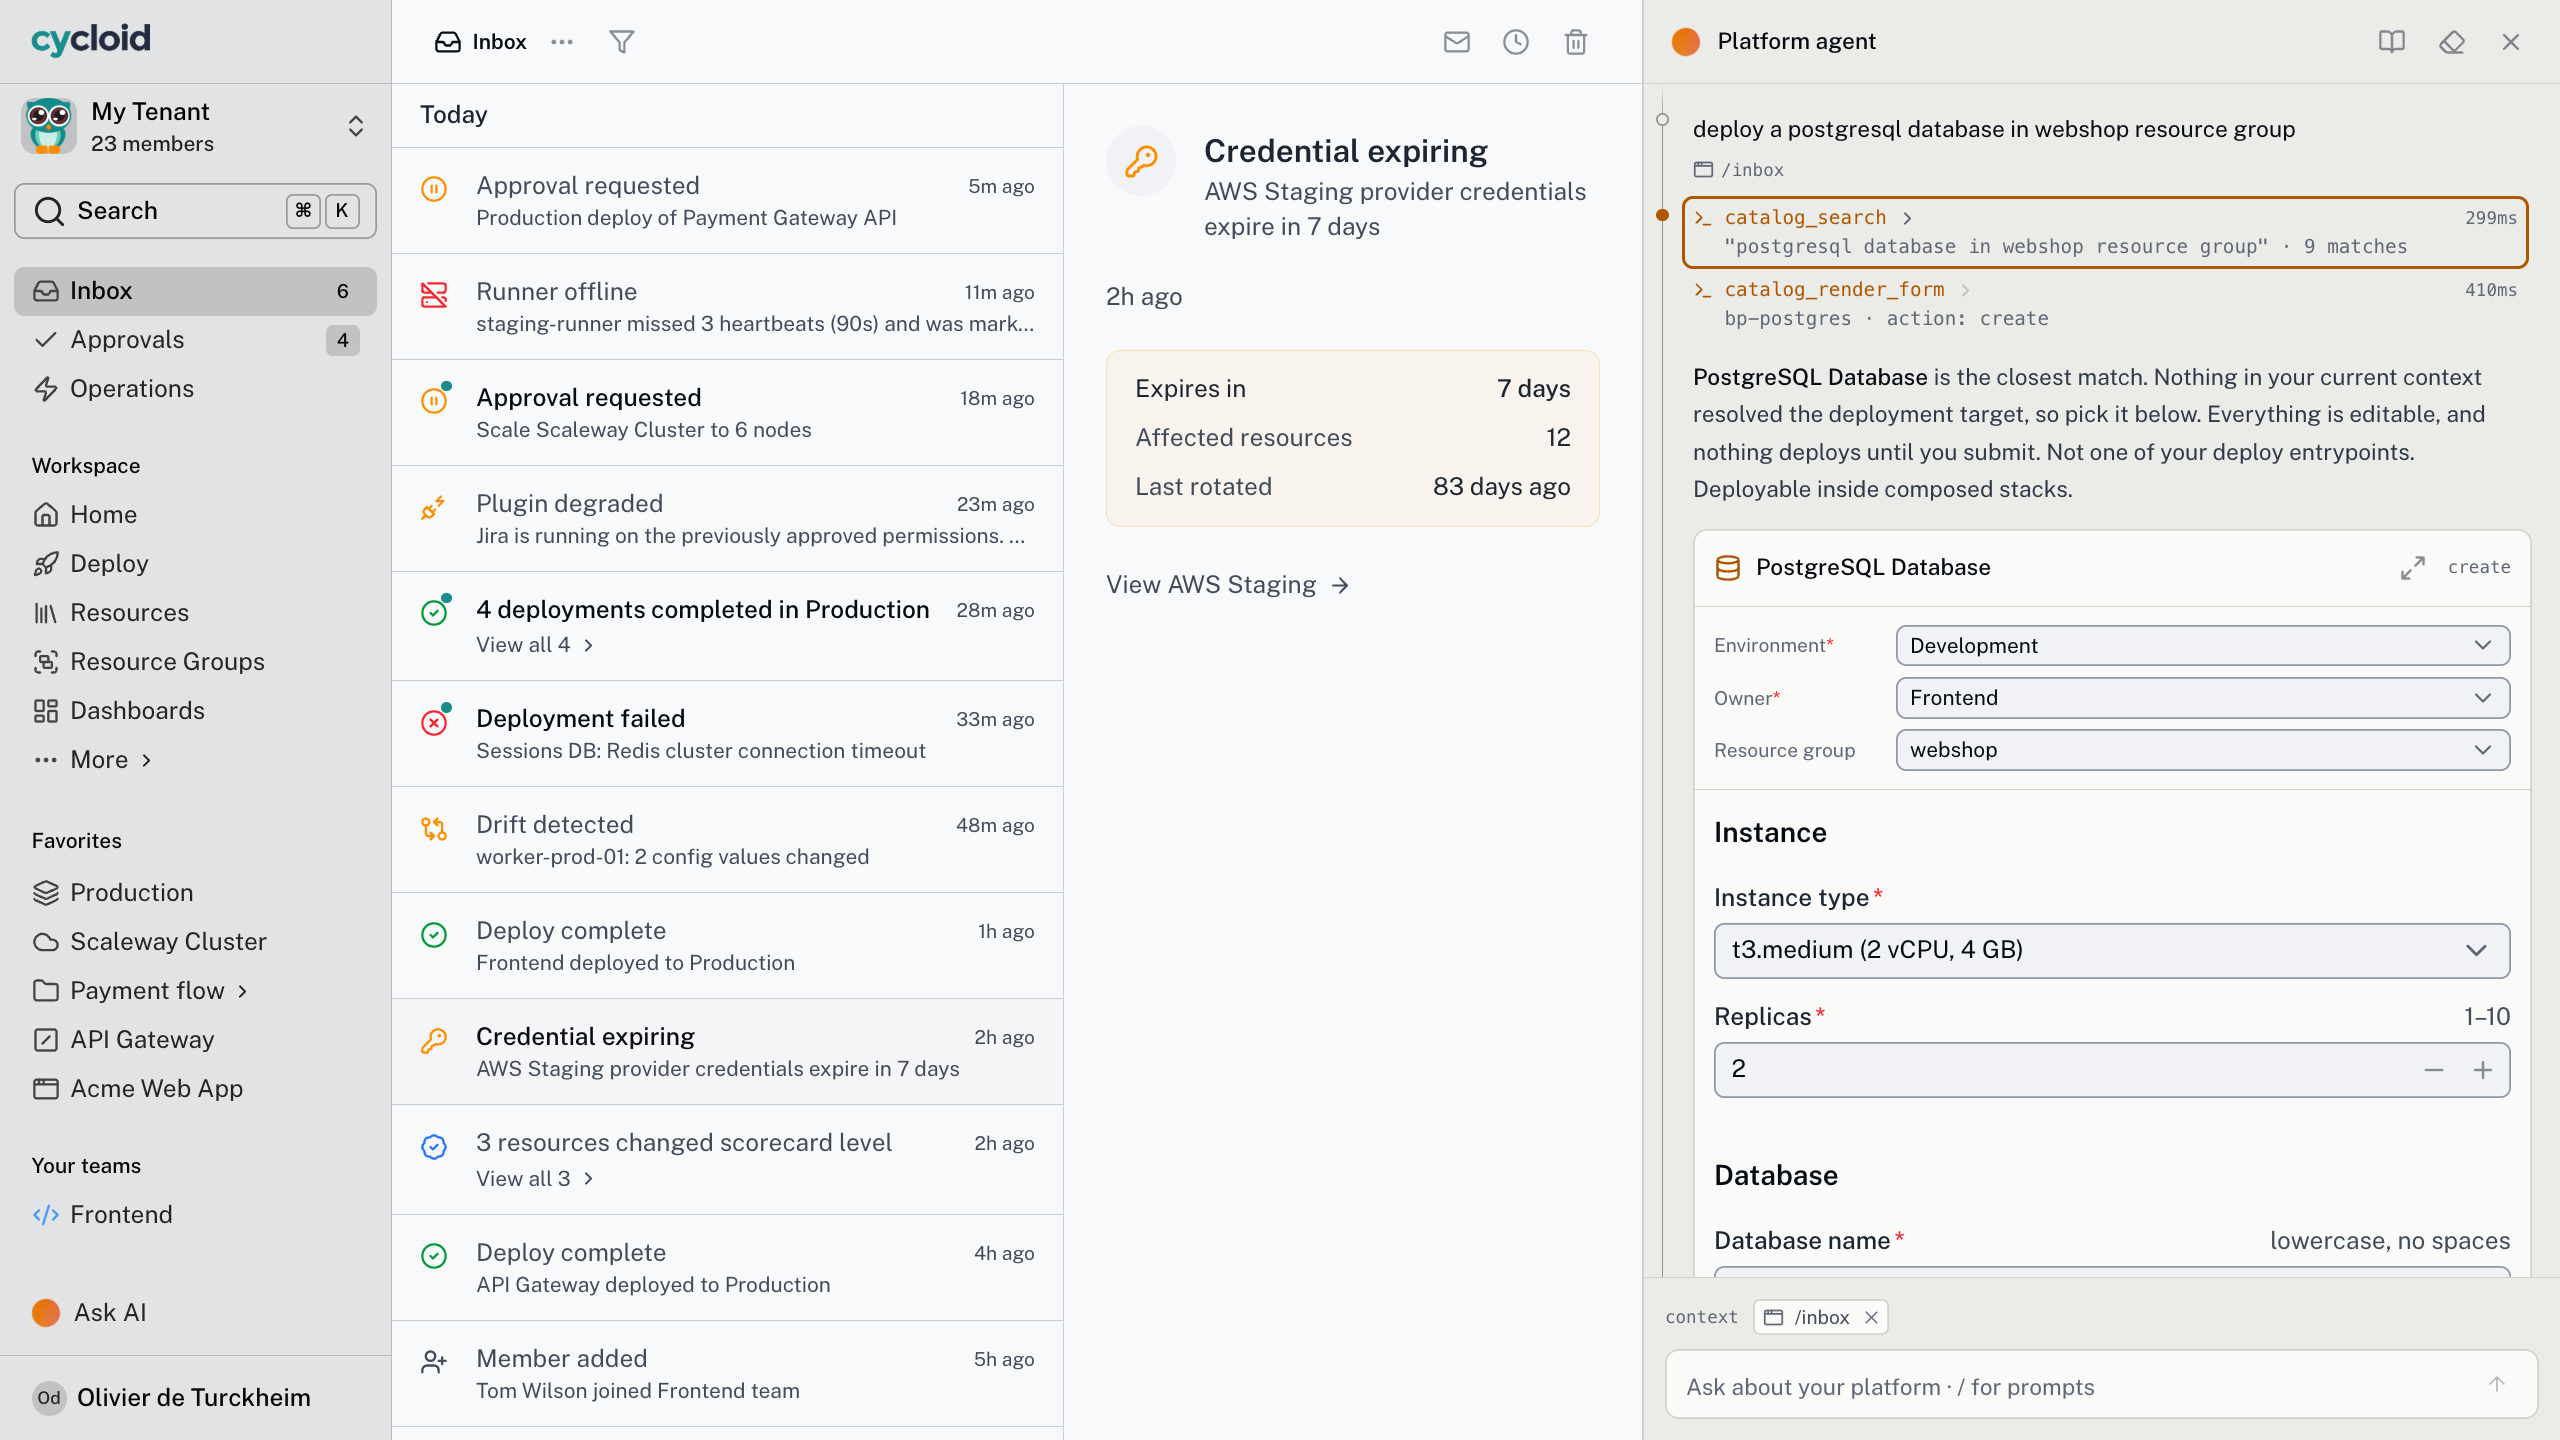

Adoption analytics
Build the platform. Then prove people use it.
A platform nobody uses is shelfware. Cycloid counts the people, the teams and the share of infrastructure work that runs through the platform, straight from its own event record.
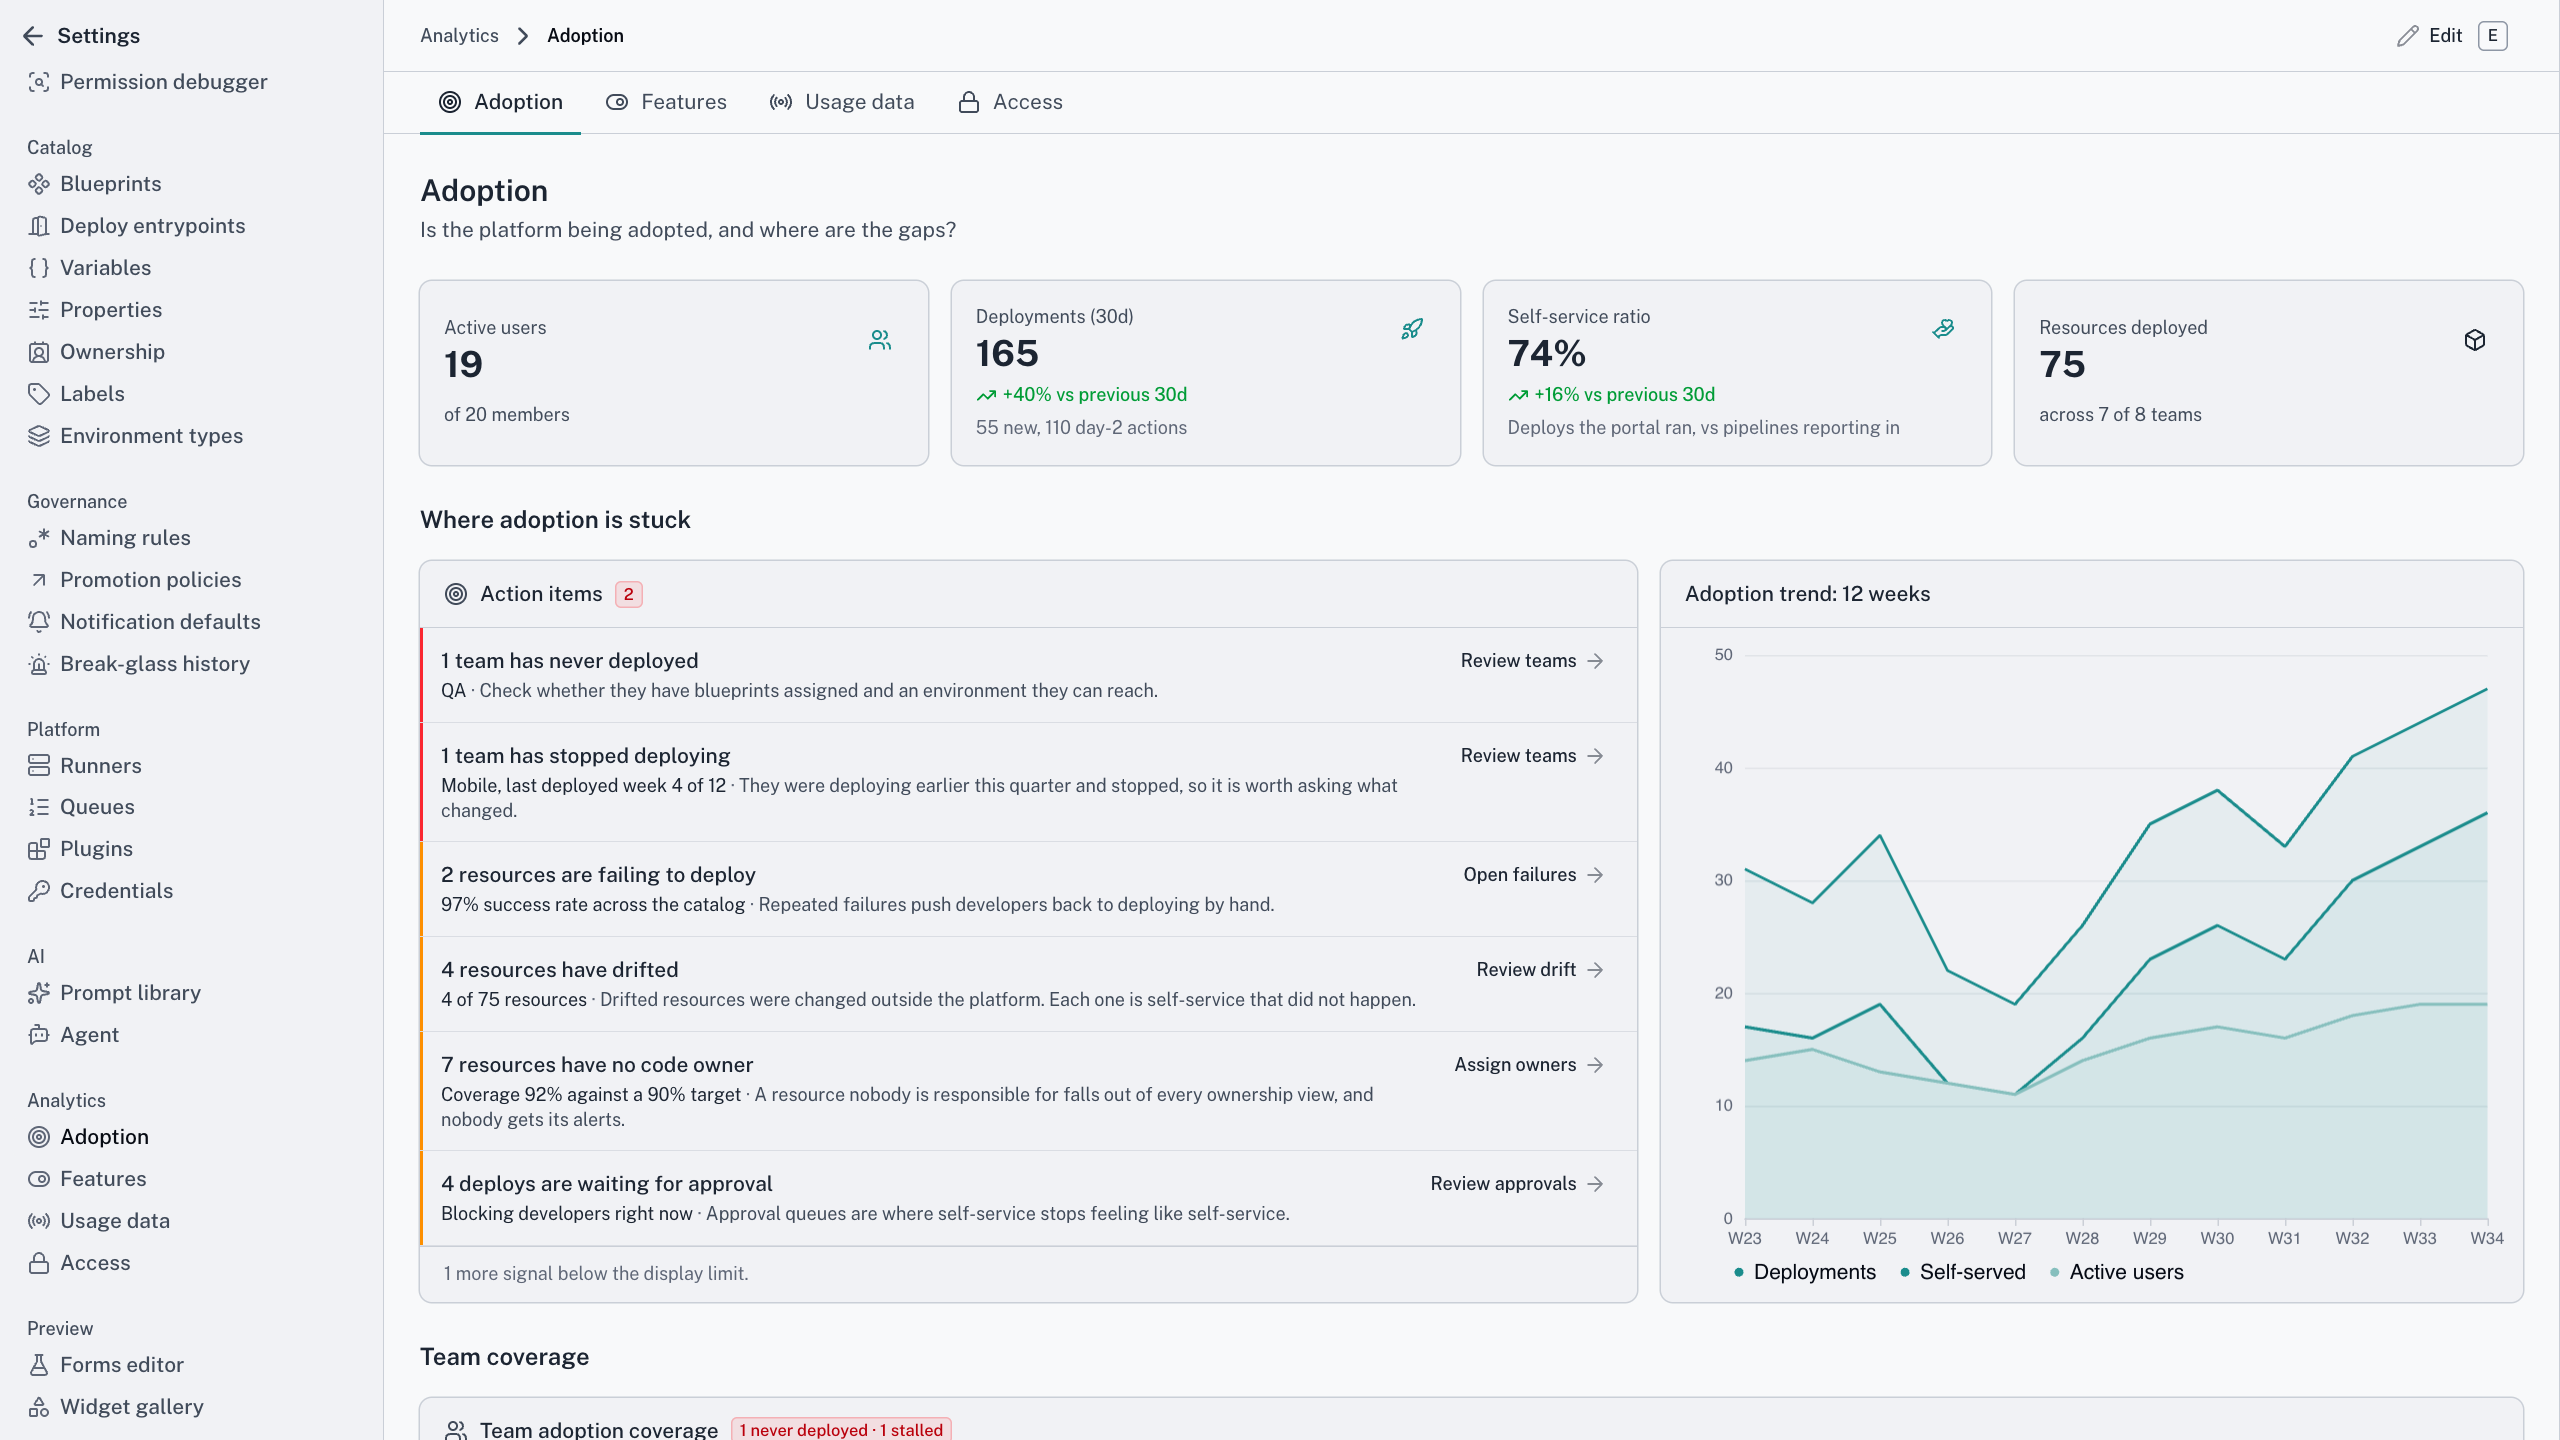
Tenant adoption dashboard
The renewal question
"Is the platform worth what we put into it?"
Someone asks this eventually, usually at renewal, usually in a room where nobody has the numbers. A feature list won’t answer it. A satisfaction survey answers a different question. Cycloid answers it from what the platform already records when people deploy, run actions and log in. Nobody fills in a thing.
Adoption
Who’s active over 7, 30 and 90 days, which teams have deployed, and how much day-2 work runs through the portal. The first deploy is easy to win. The fiftieth restart proves it stuck.
Deployment health
Success rate, time to deployed, and where failures cluster by Blueprint and team. Plus the approvals still pending, which is usually where the queue really is.
Catalog health
Which Blueprints nobody uses, which resources lag the latest version, and what has no owner. The retirement list writes itself.
Cycloid for your team
Who reads the adoption dashboard, and for what
Prove it, then close the gaps
The problem
You know the platform works. You can’t prove it’s used, and the budget conversation happens without you in it.
With Cycloid
The adoption dashboard names the teams at zero, the Blueprints nobody has touched and where deployments fail, per team and per Blueprint.
The outcome
The gaps arrive as a work list, not as an argument.
Your own activity, not your score
The problem
Analytics in a developer tool usually means somebody upstairs counting your commits.
With Cycloid
A personal feed of what you deployed, approvals waiting on you and recent actions across your teams. Adoption metrics count behaviour at team and tenant level.
The outcome
A “what happened while I was away” page, and nobody’s performance report.
Renew on evidence
The problem
You’re asked to renew a platform whose value currently lives in anecdotes and one enthusiastic team.
With Cycloid
Self-service ratio over time, team adoption coverage, deployment frequency trend and the actions developers take most, on live data.
The outcome
You answer the investment question from the same view the platform team works from.
How it works
From recorded work to a renewal answer
01 · It records the work
Logins, deployments, action runs and approvals become events in your own database. No tracker, no session recording, no third-party tag.
02 · It ignores the helpers
Admin impersonation and sandbox tenants don’t count. A week of support shouldn’t look like a week of adoption.
03 · It lands on a dashboard
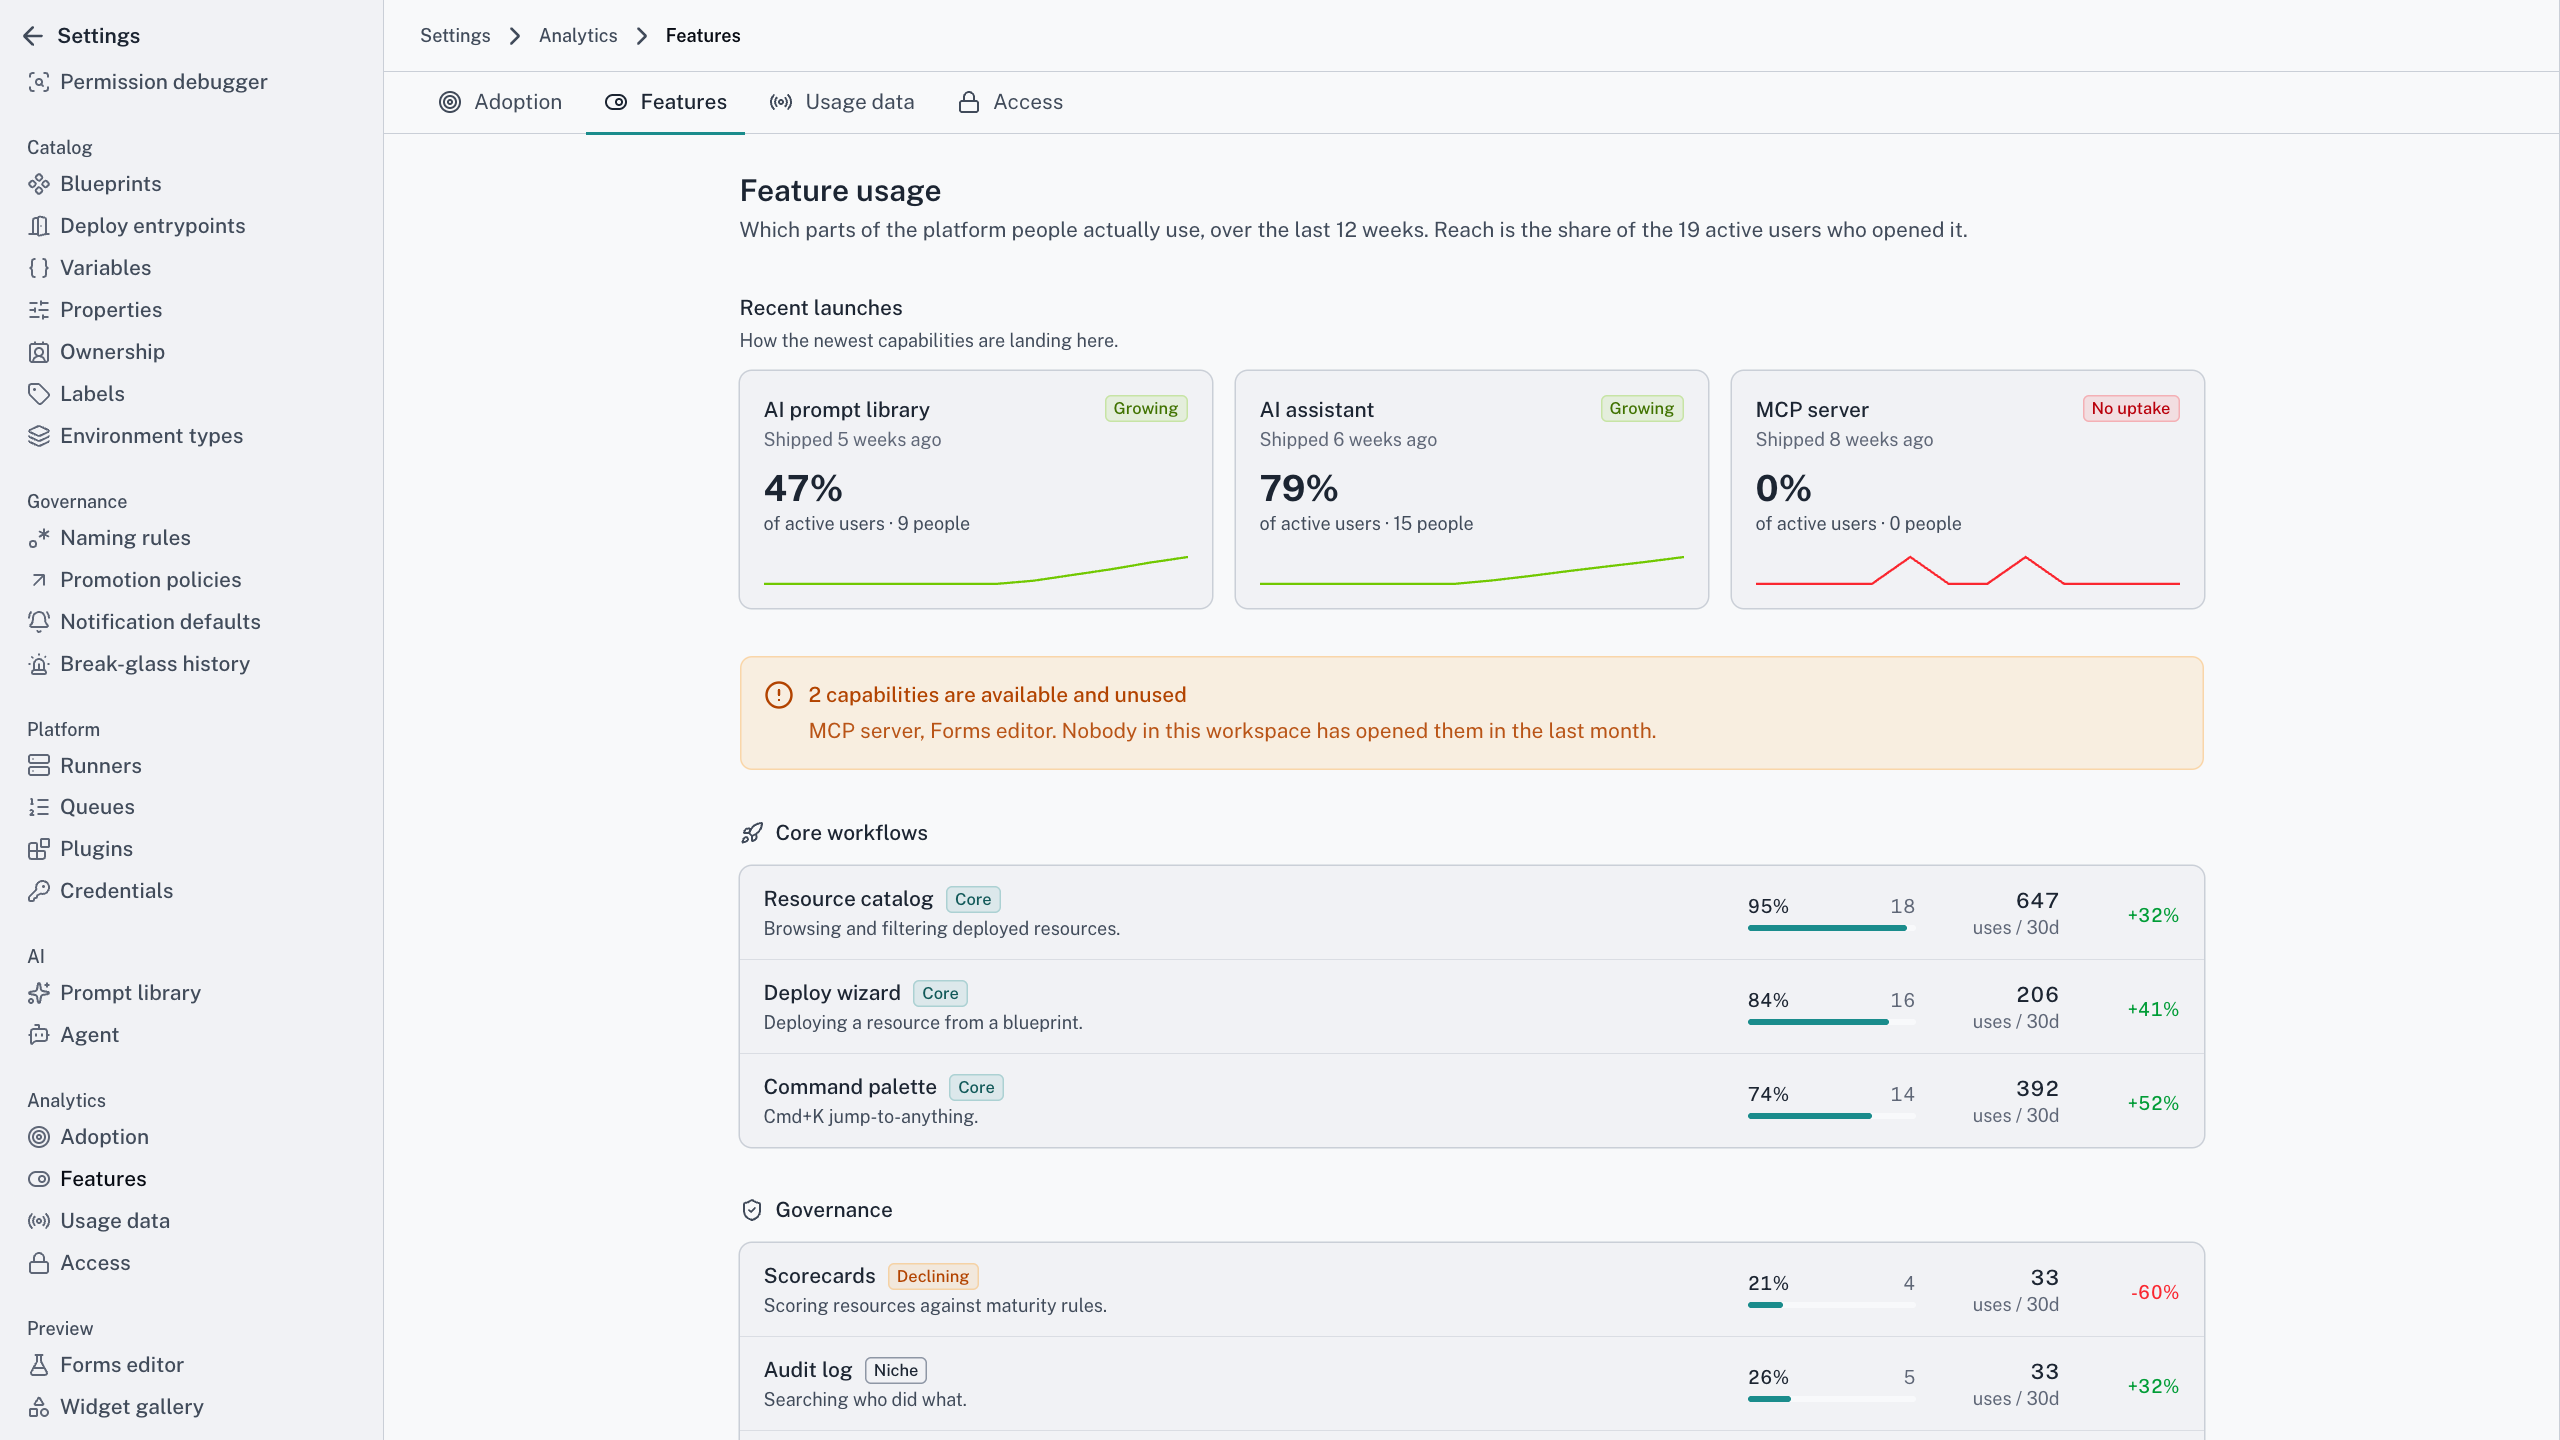
Adoption is a template on the dashboard engine, with a twelve-week trend, a per-team breakdown and a panel naming the teams at zero.
04 · You make it yours
Add a panel, change the window, clone it for one team. Time saved runs on your estimate of minutes saved, not ours.
05 · Everyone reads it as themselves
Analytics never cross tenants. Every dashboard runs under the reader’s permissions, so a forwarded link shows nothing extra.
The number that settles it is self-service ratio, the share of deployments that go through the portal instead of round it. Everything else describes activity. This one shows whether behaviour moved. When it stalls, the cause is usually a missing Blueprint or a three-day approval, not a lack of enthusiasm.
From recorded work to a renewal answer
The short version
The numbers about the numbers
3
ways to count active users: 7, 30 and 90 days
12
weeks of trend. The direction is the story
0
trackers in your developers’ browsers
0
surveys. It counts what people actually did
Which teams haven’t deployed this quarter?

Four teams have no deployments in the last 90 days. Two of them have never deployed at all, which is a different problem from having stopped.
Metric · active teams, 90 days
Read as you
Scope
Teams you can see
Excluded
Impersonation sessions, sandbox tenants
Working with your assistant
Ask whether it's working, and see the working
Does the assistant get its own permissions?
No. There’s no service account and no elevated assistant role. If you can’t deploy to production, neither can the assistant you’re talking to, in Cycloid’s own assistant or any compliant MCP host.
Ask which teams haven’t deployed this quarter and your assistant reads the same metrics, under your permissions. If the answer’s worth keeping, it clones the adoption template into your team’s scope.
It reports the number and where it came from. It doesn’t grade anyone. A board-level health score and a measure of what an assistant saved you are still to come, and they’ll be measured, not modelled.
Frequently asked questions
The share of deployments triggered through the portal rather than by direct IaC runs or API calls. Capability is easy to buy. This measures the behaviour change you actually paid for, as a twelve-week trend.
Not for adoption. The dashboards query Cycloid’s own API, so the numbers stay inside the permission model and nobody maintains an export. You can still export to JSON when you need it elsewhere.
Yes. The tenant templates are shared with everyone by default, on purpose. If that’s wrong for you, deploy team-scoped copies instead, and each one shows a single team’s numbers.
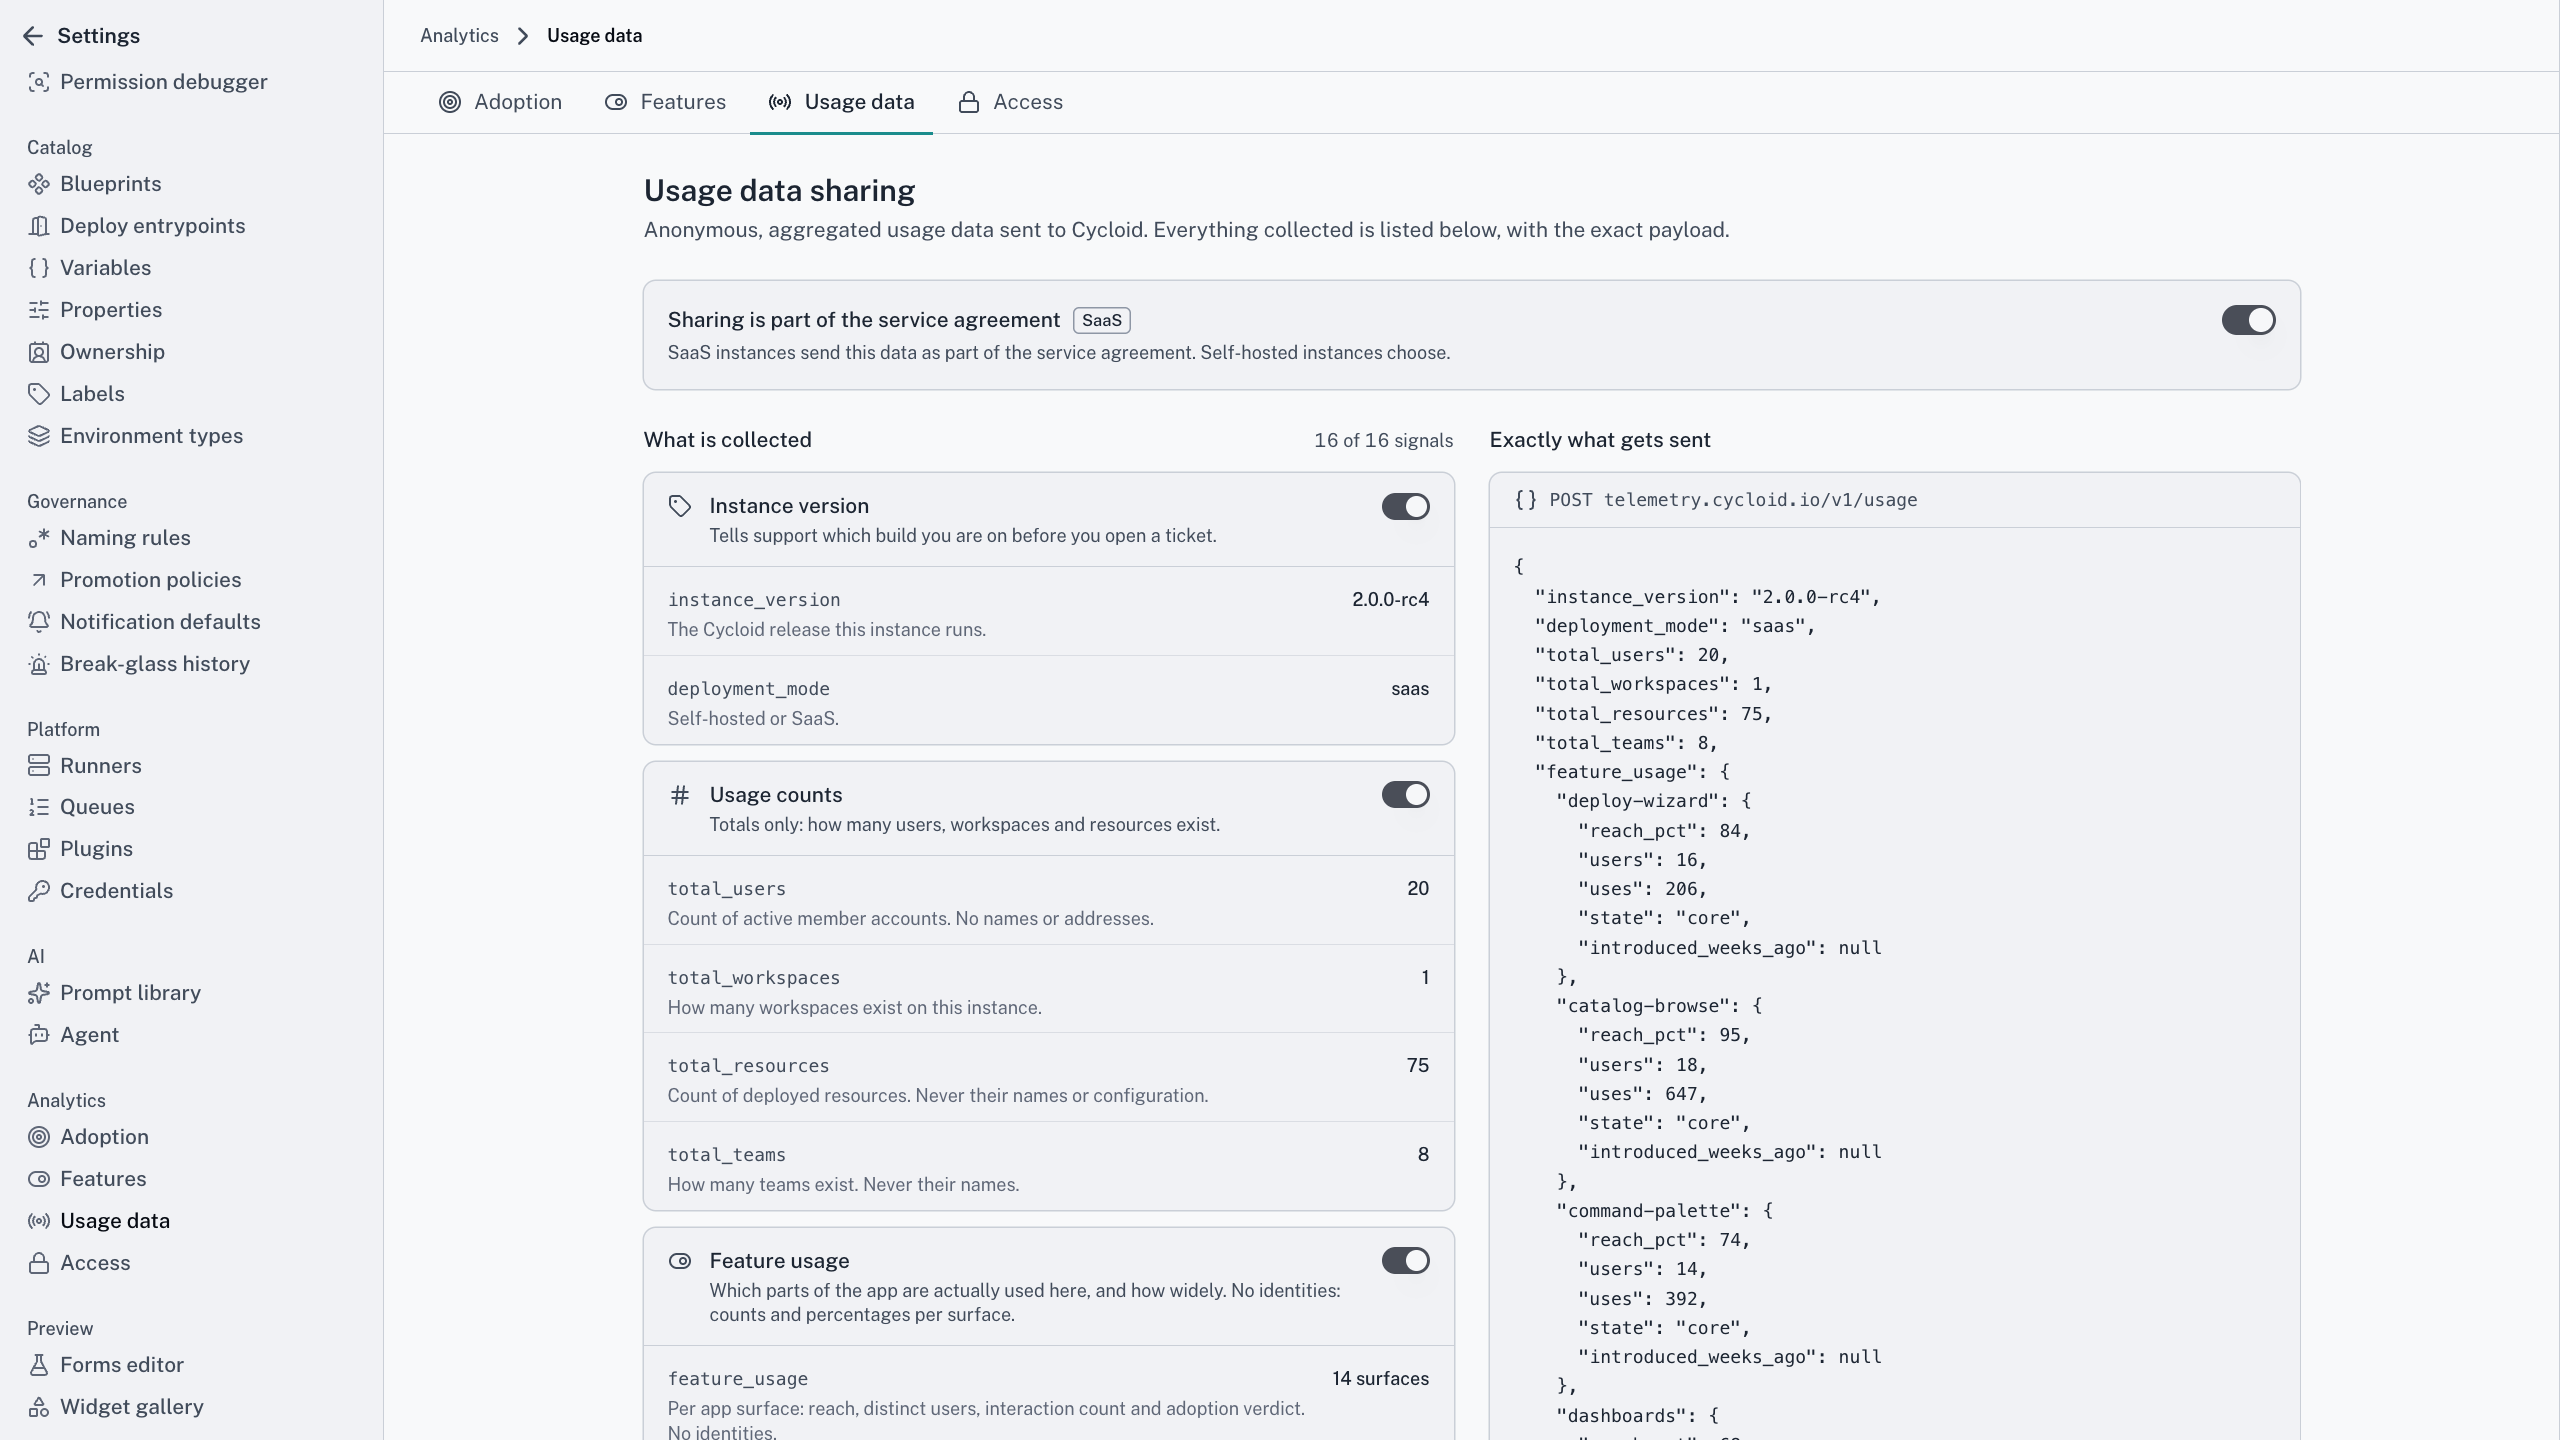
Not unless you say so. Self-hosted, telemetry to Cycloid starts switched off. Switched on, it’s aggregated and anonymous, never names, form content or credentials, and the full list is published.
Find out what your ratio actually is
Most platform teams guess it high. In twenty minutes we’ll walk the adoption dashboard on your own data and show you which teams are at zero and which Blueprints nobody has used.