

Solutions / Portal & Visibility
See every service, every owner, every dependency in one place
Six tools, six answers, and no two of them agree. Cycloid keeps what exists, who owns it, how it connects and how well it’s kept on one record. It’s the record the platform deploys from, so you can act on it, not just read it.
Developers
Find the service, the owner and the docs without asking in Slack.
Platform & DevOps
One inventory across clouds, with the IaC coverage number you’d otherwise build by hand.
Executives
Ownership, maturity and coverage on one dashboard, in the same platform that enforces them.
Why
A portal that only displays is a wiki with a search box
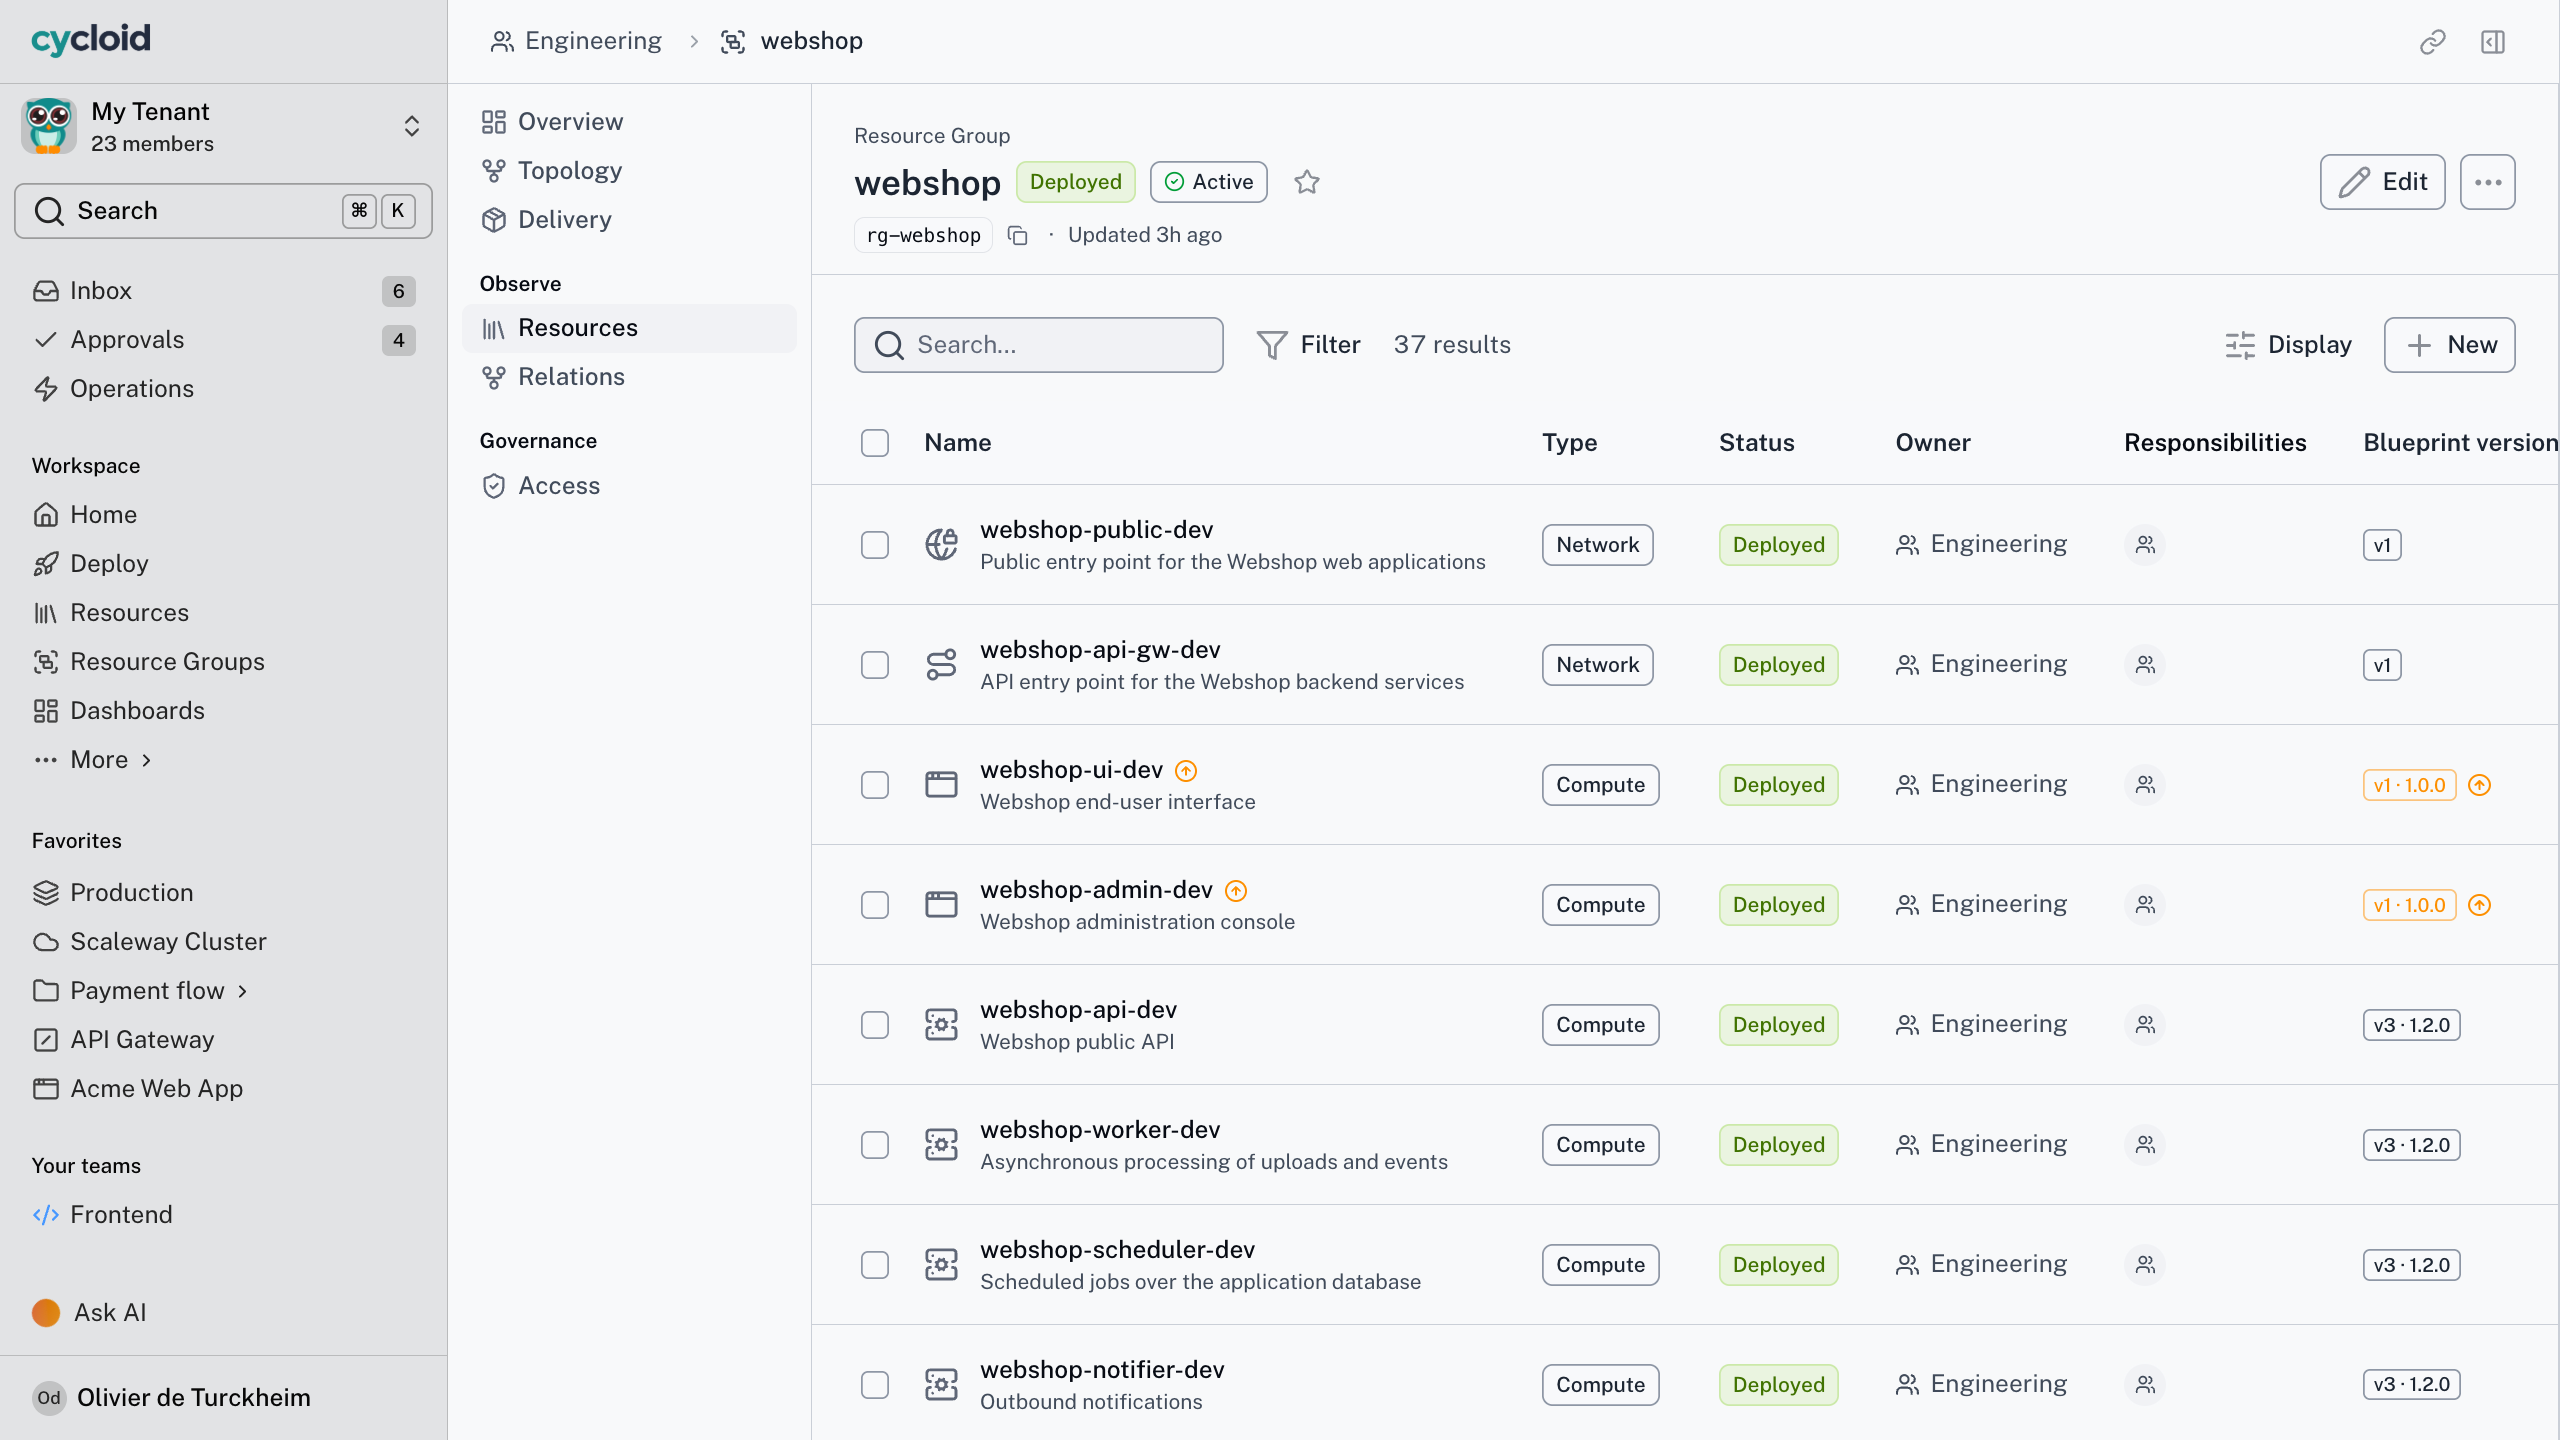
Most portals stop at the catalog. They tell you a service exists and who last touched it, and then the real work moves to a ticket somewhere else. The record drifts from the infrastructure the moment someone deploys around it. Cycloid’s internal developer portal reads the record the platform deploys from, so the two stay in step.
Without it
The spreadsheet of record
Ownership lives in a spreadsheet, dependencies in someone’s head, and IaC coverage in a quarterly audit. Each one was right the day it was written.
Signs it’s your problem
- Nobody can say who owns a service during an incident
- Two clouds, three inventories, none of them match
- IaC coverage is a guess, and it’s usually generous

With Cycloid
The record the platform runs on
The catalog, the graph and the inventory are populated by the same Blueprints, Actions and Discovery that deploy and operate the infrastructure. Nothing’s rebuilt afterwards, because nothing happened elsewhere.
What changes
- Ownership is attached at deploy time, not reverse-engineered later
- Dependencies are drawn from discovered assets, not from a diagram
- Coverage and maturity are numbers the platform computes, on a schedule
The trade-off · display vs execution · one record does both
How
From cloud inventory to a dashboard your CTO reads
Four steps, each with a page of its own. The first two feed the record, the last two read it.
What
Six features behind the single pane of glass
Each has a page of its own. Here’s what it does, how, and who it’s for. Want the portal itself to change shape?
In this pillar
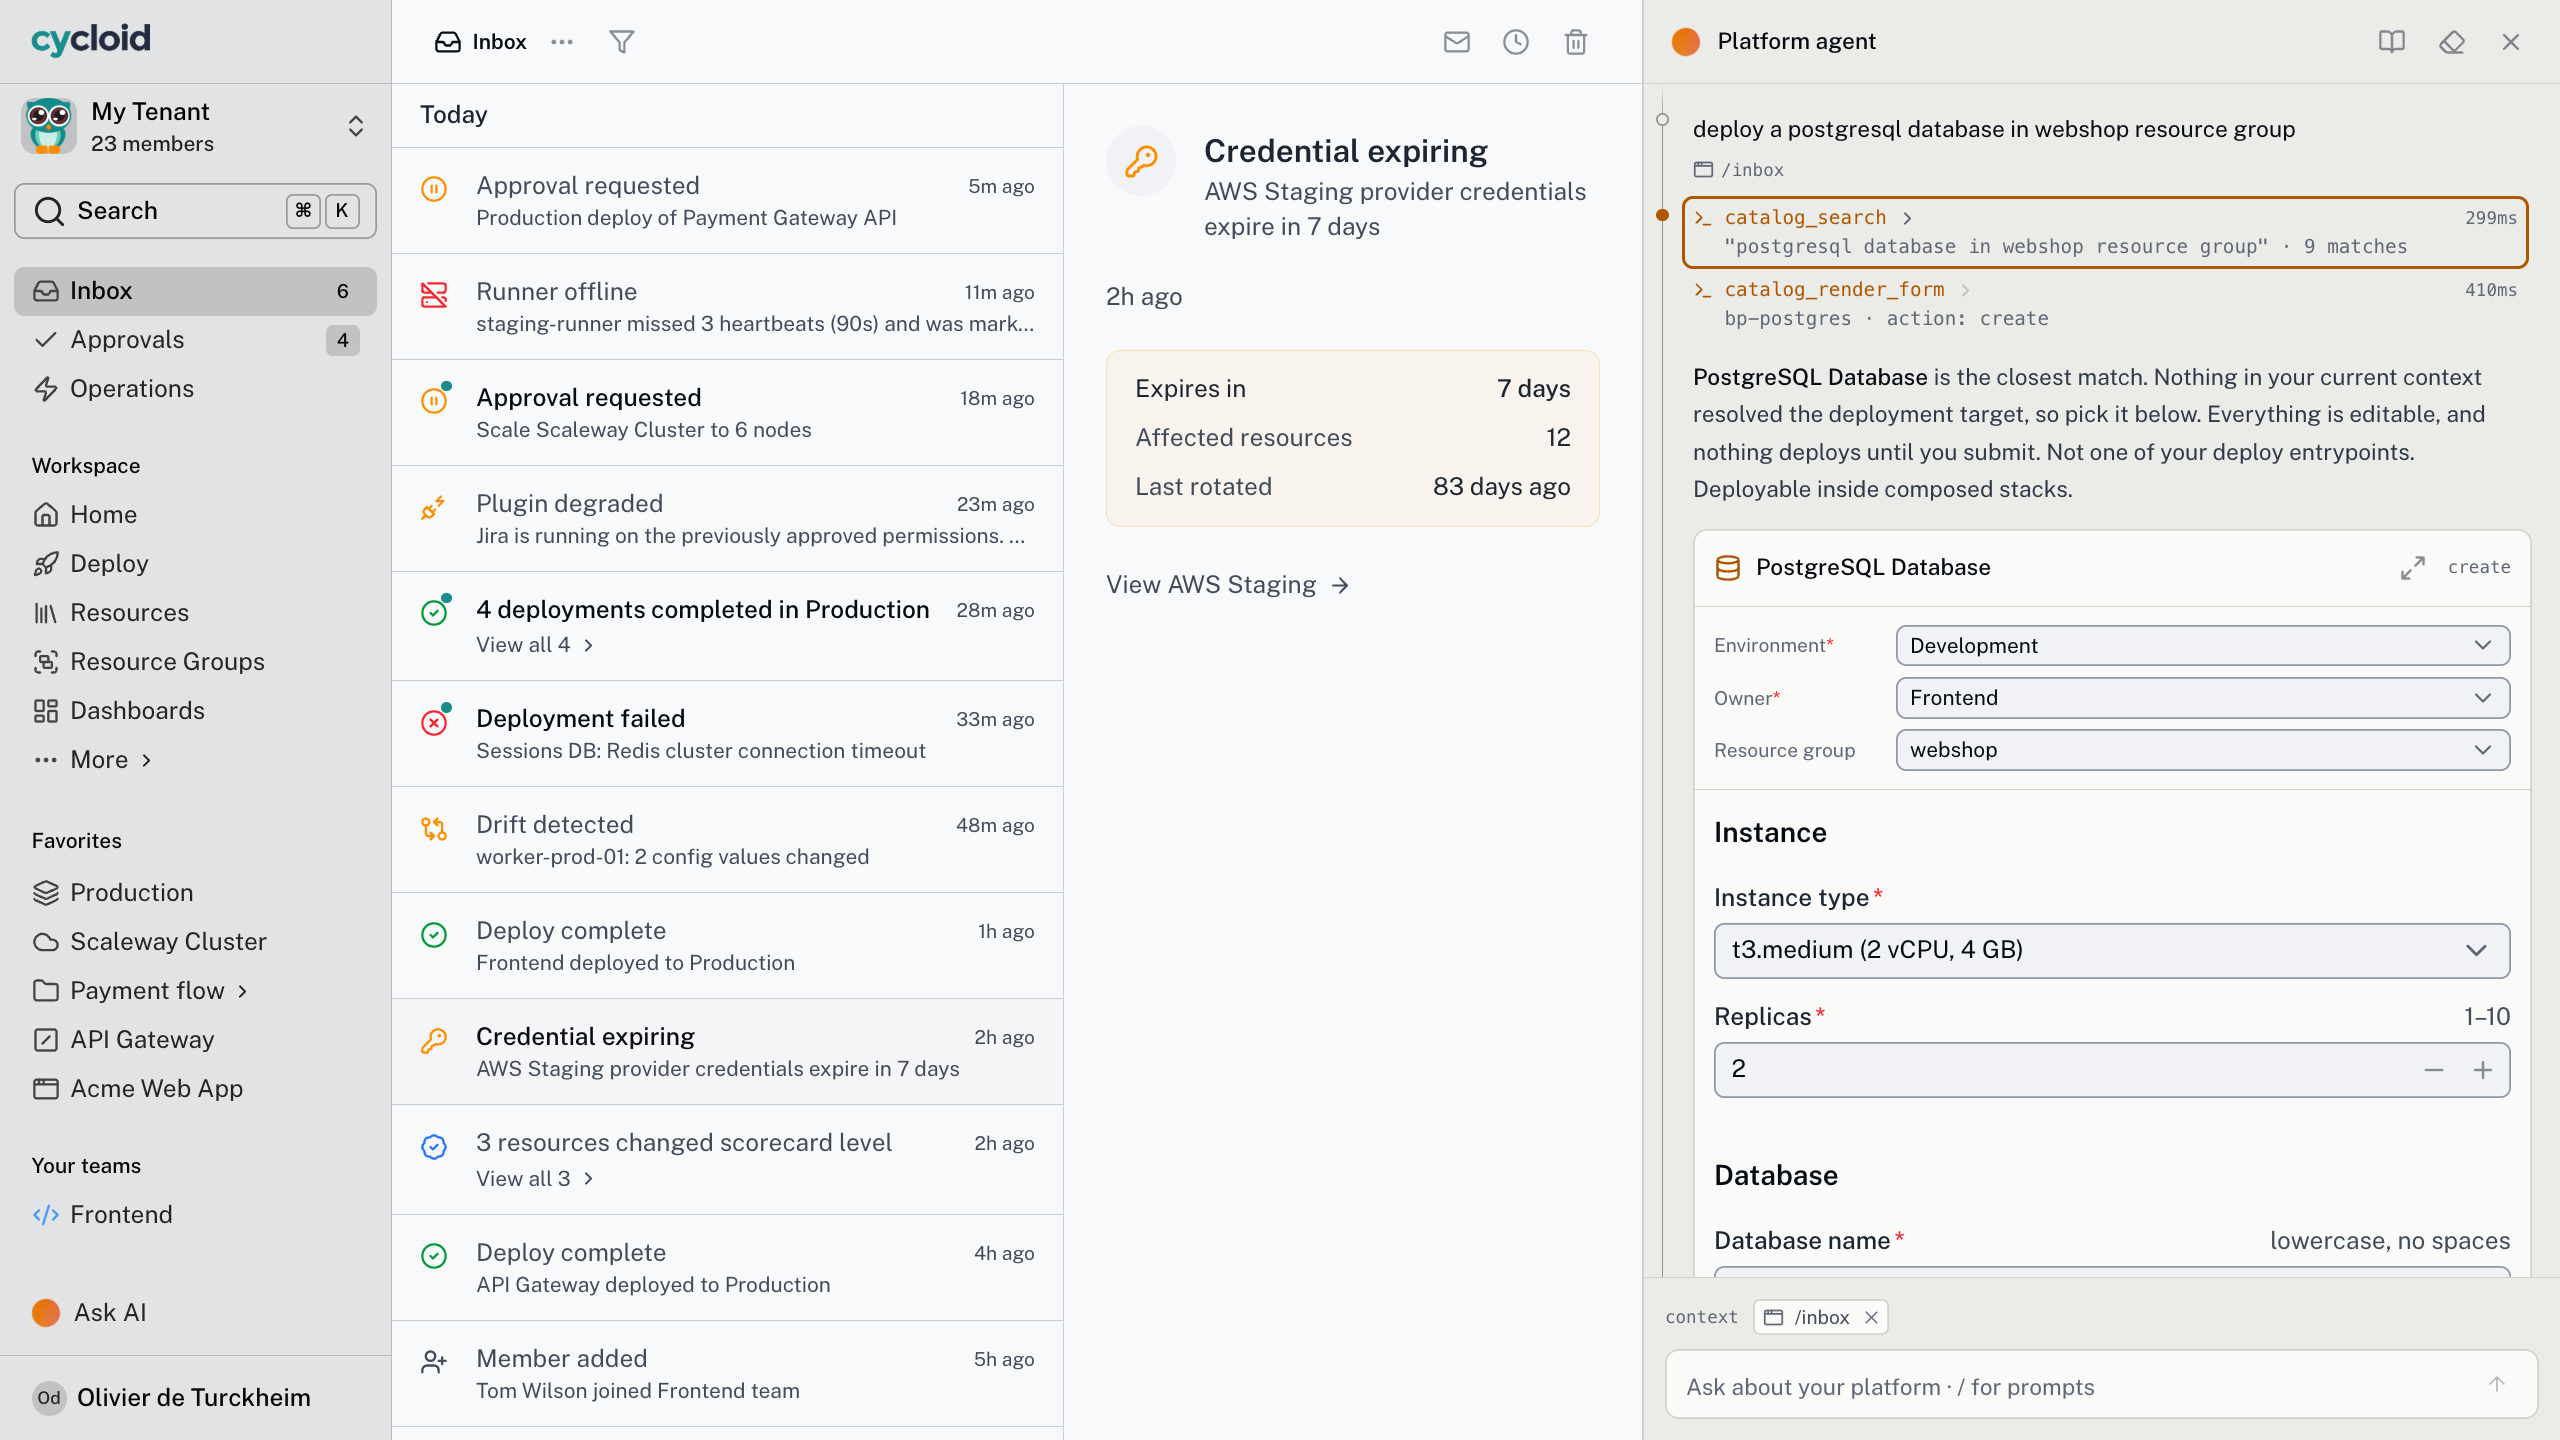
Software catalog & ownership
Lists every service and Resource with its team, owner, Resource Group and lifecycle, searchable by anyone who’s allowed to see it.
Ownership’s set when a Blueprint deploys, so the catalog fills itself as you deliver.
Built for
Developers
Platform & DevOps
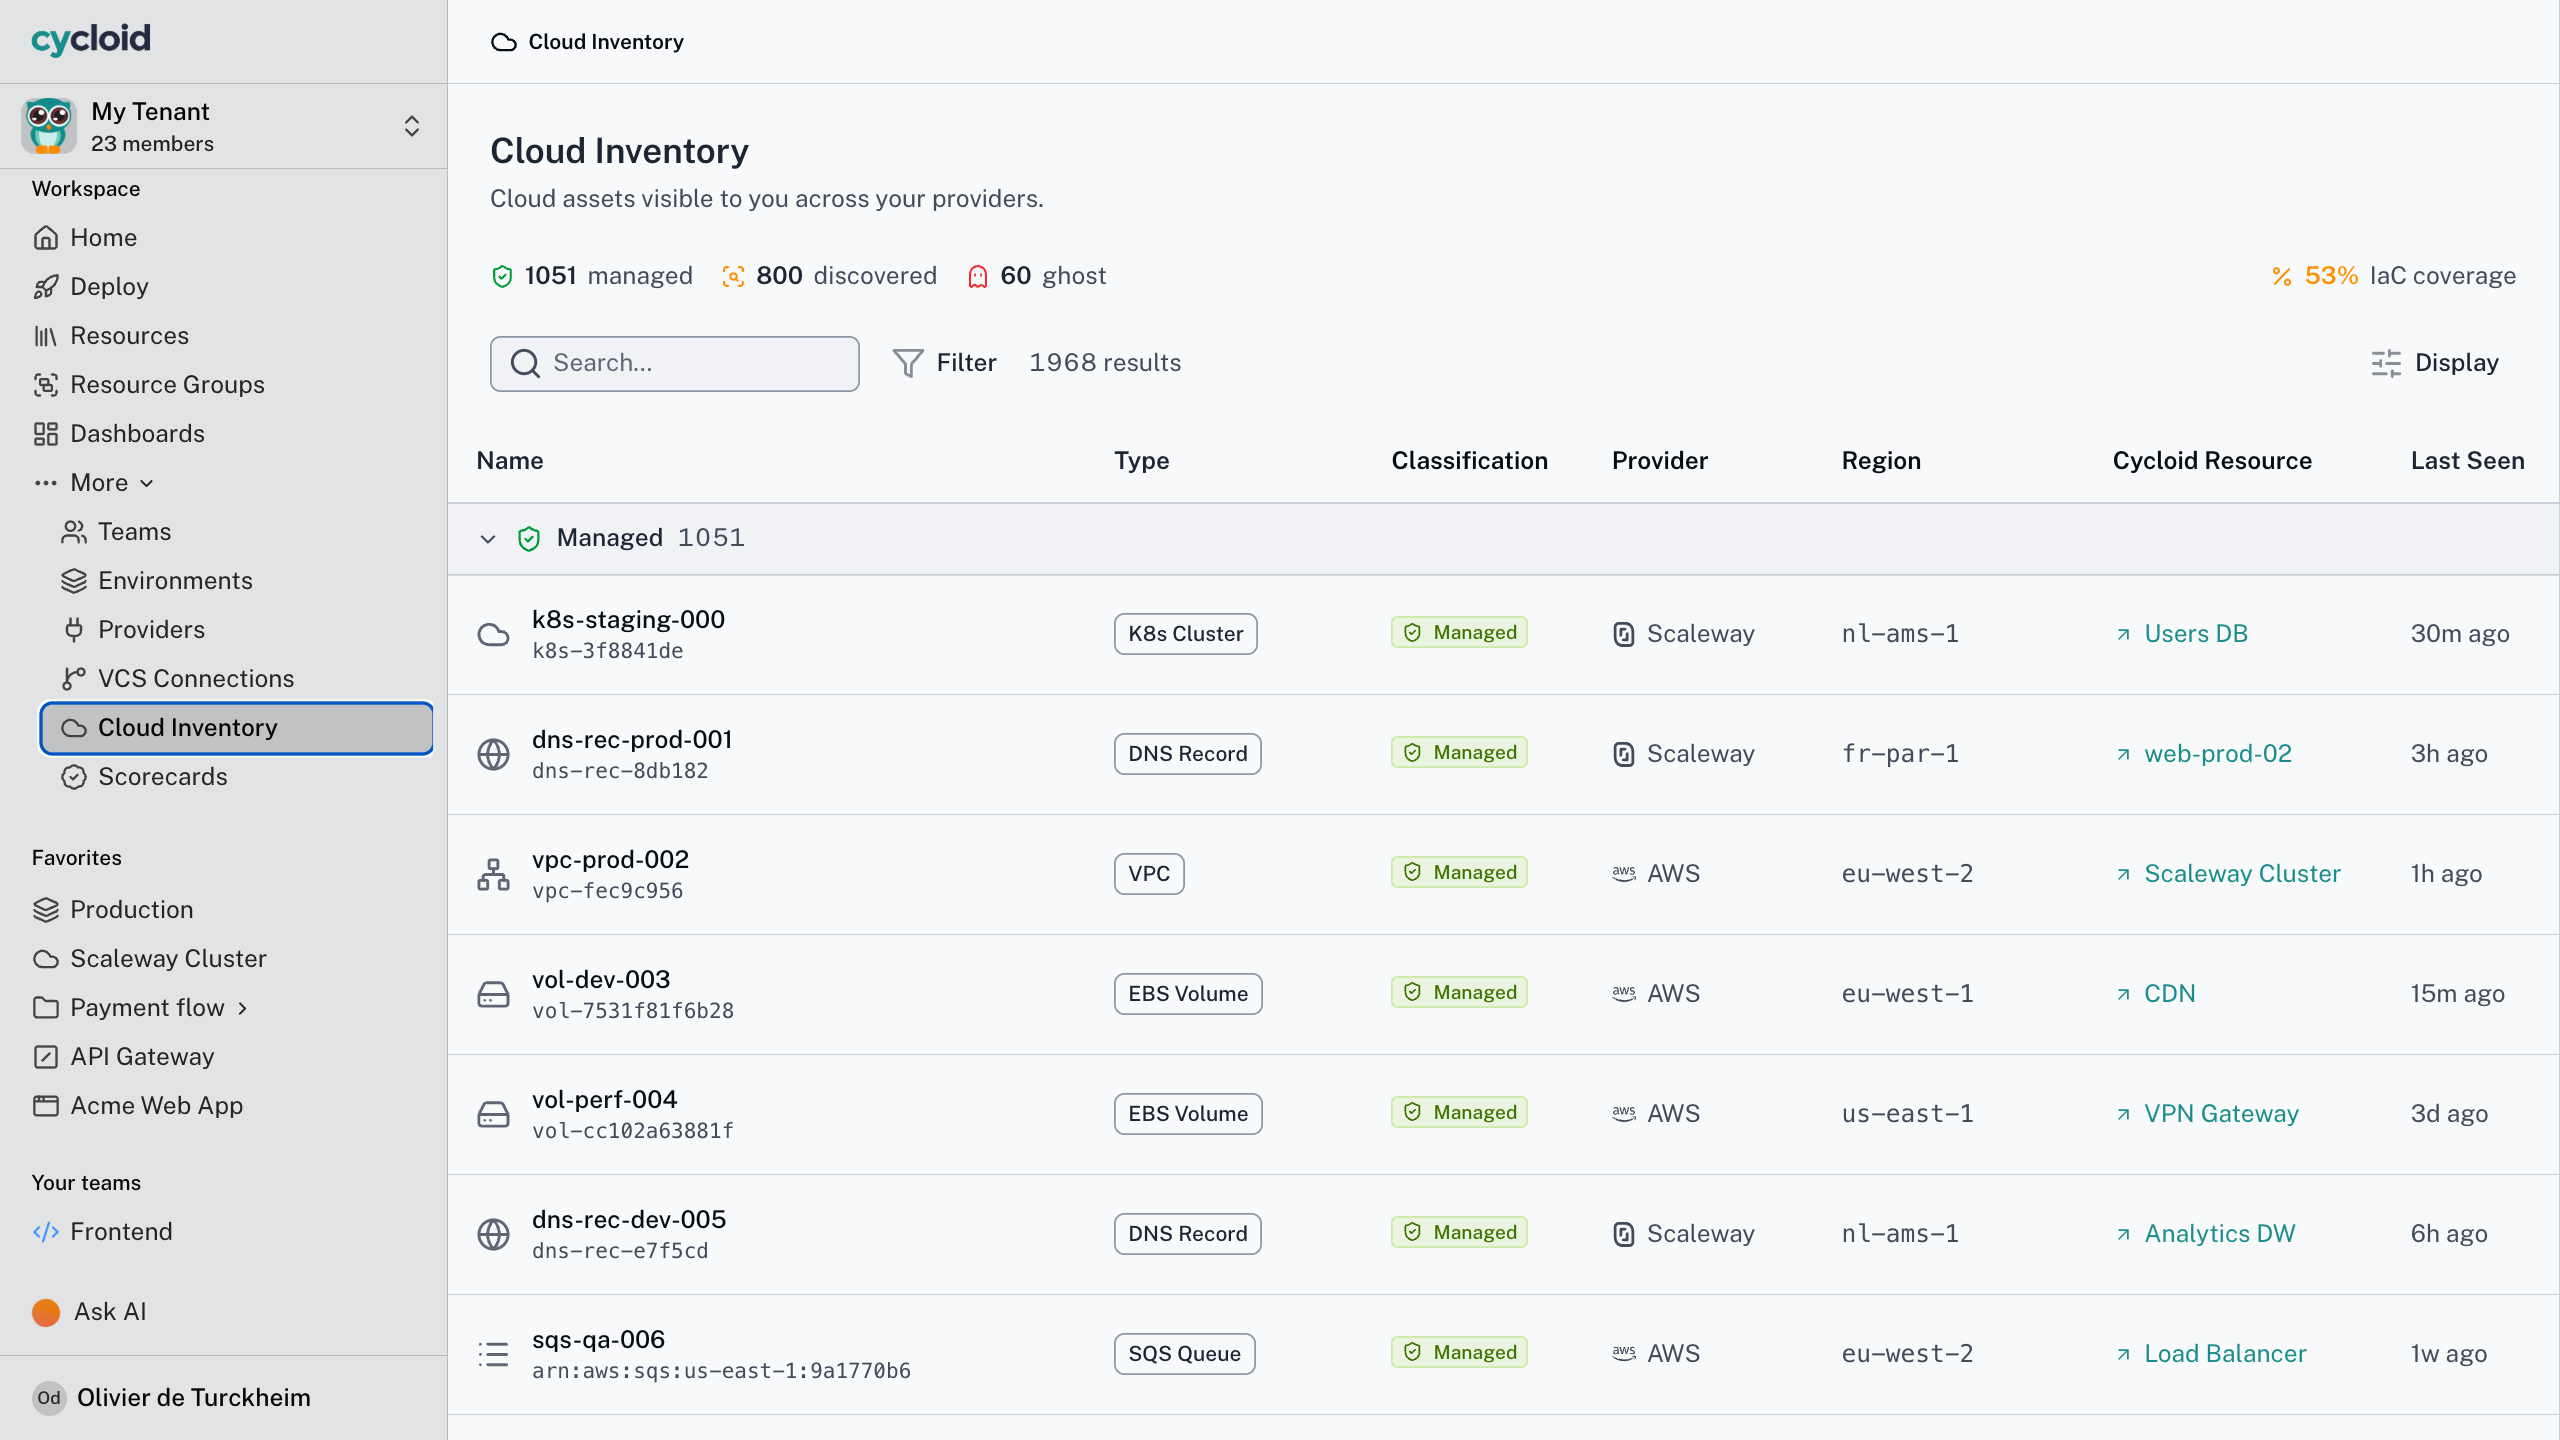
Asset inventory & IaC coverage
Records every asset across AWS, Azure, GCP and Kubernetes, and works out how much of it IaC manages.
Discovery runs read-only on a schedule, and daily snapshots show coverage move.
Built for
Platform & DevOps
Executives
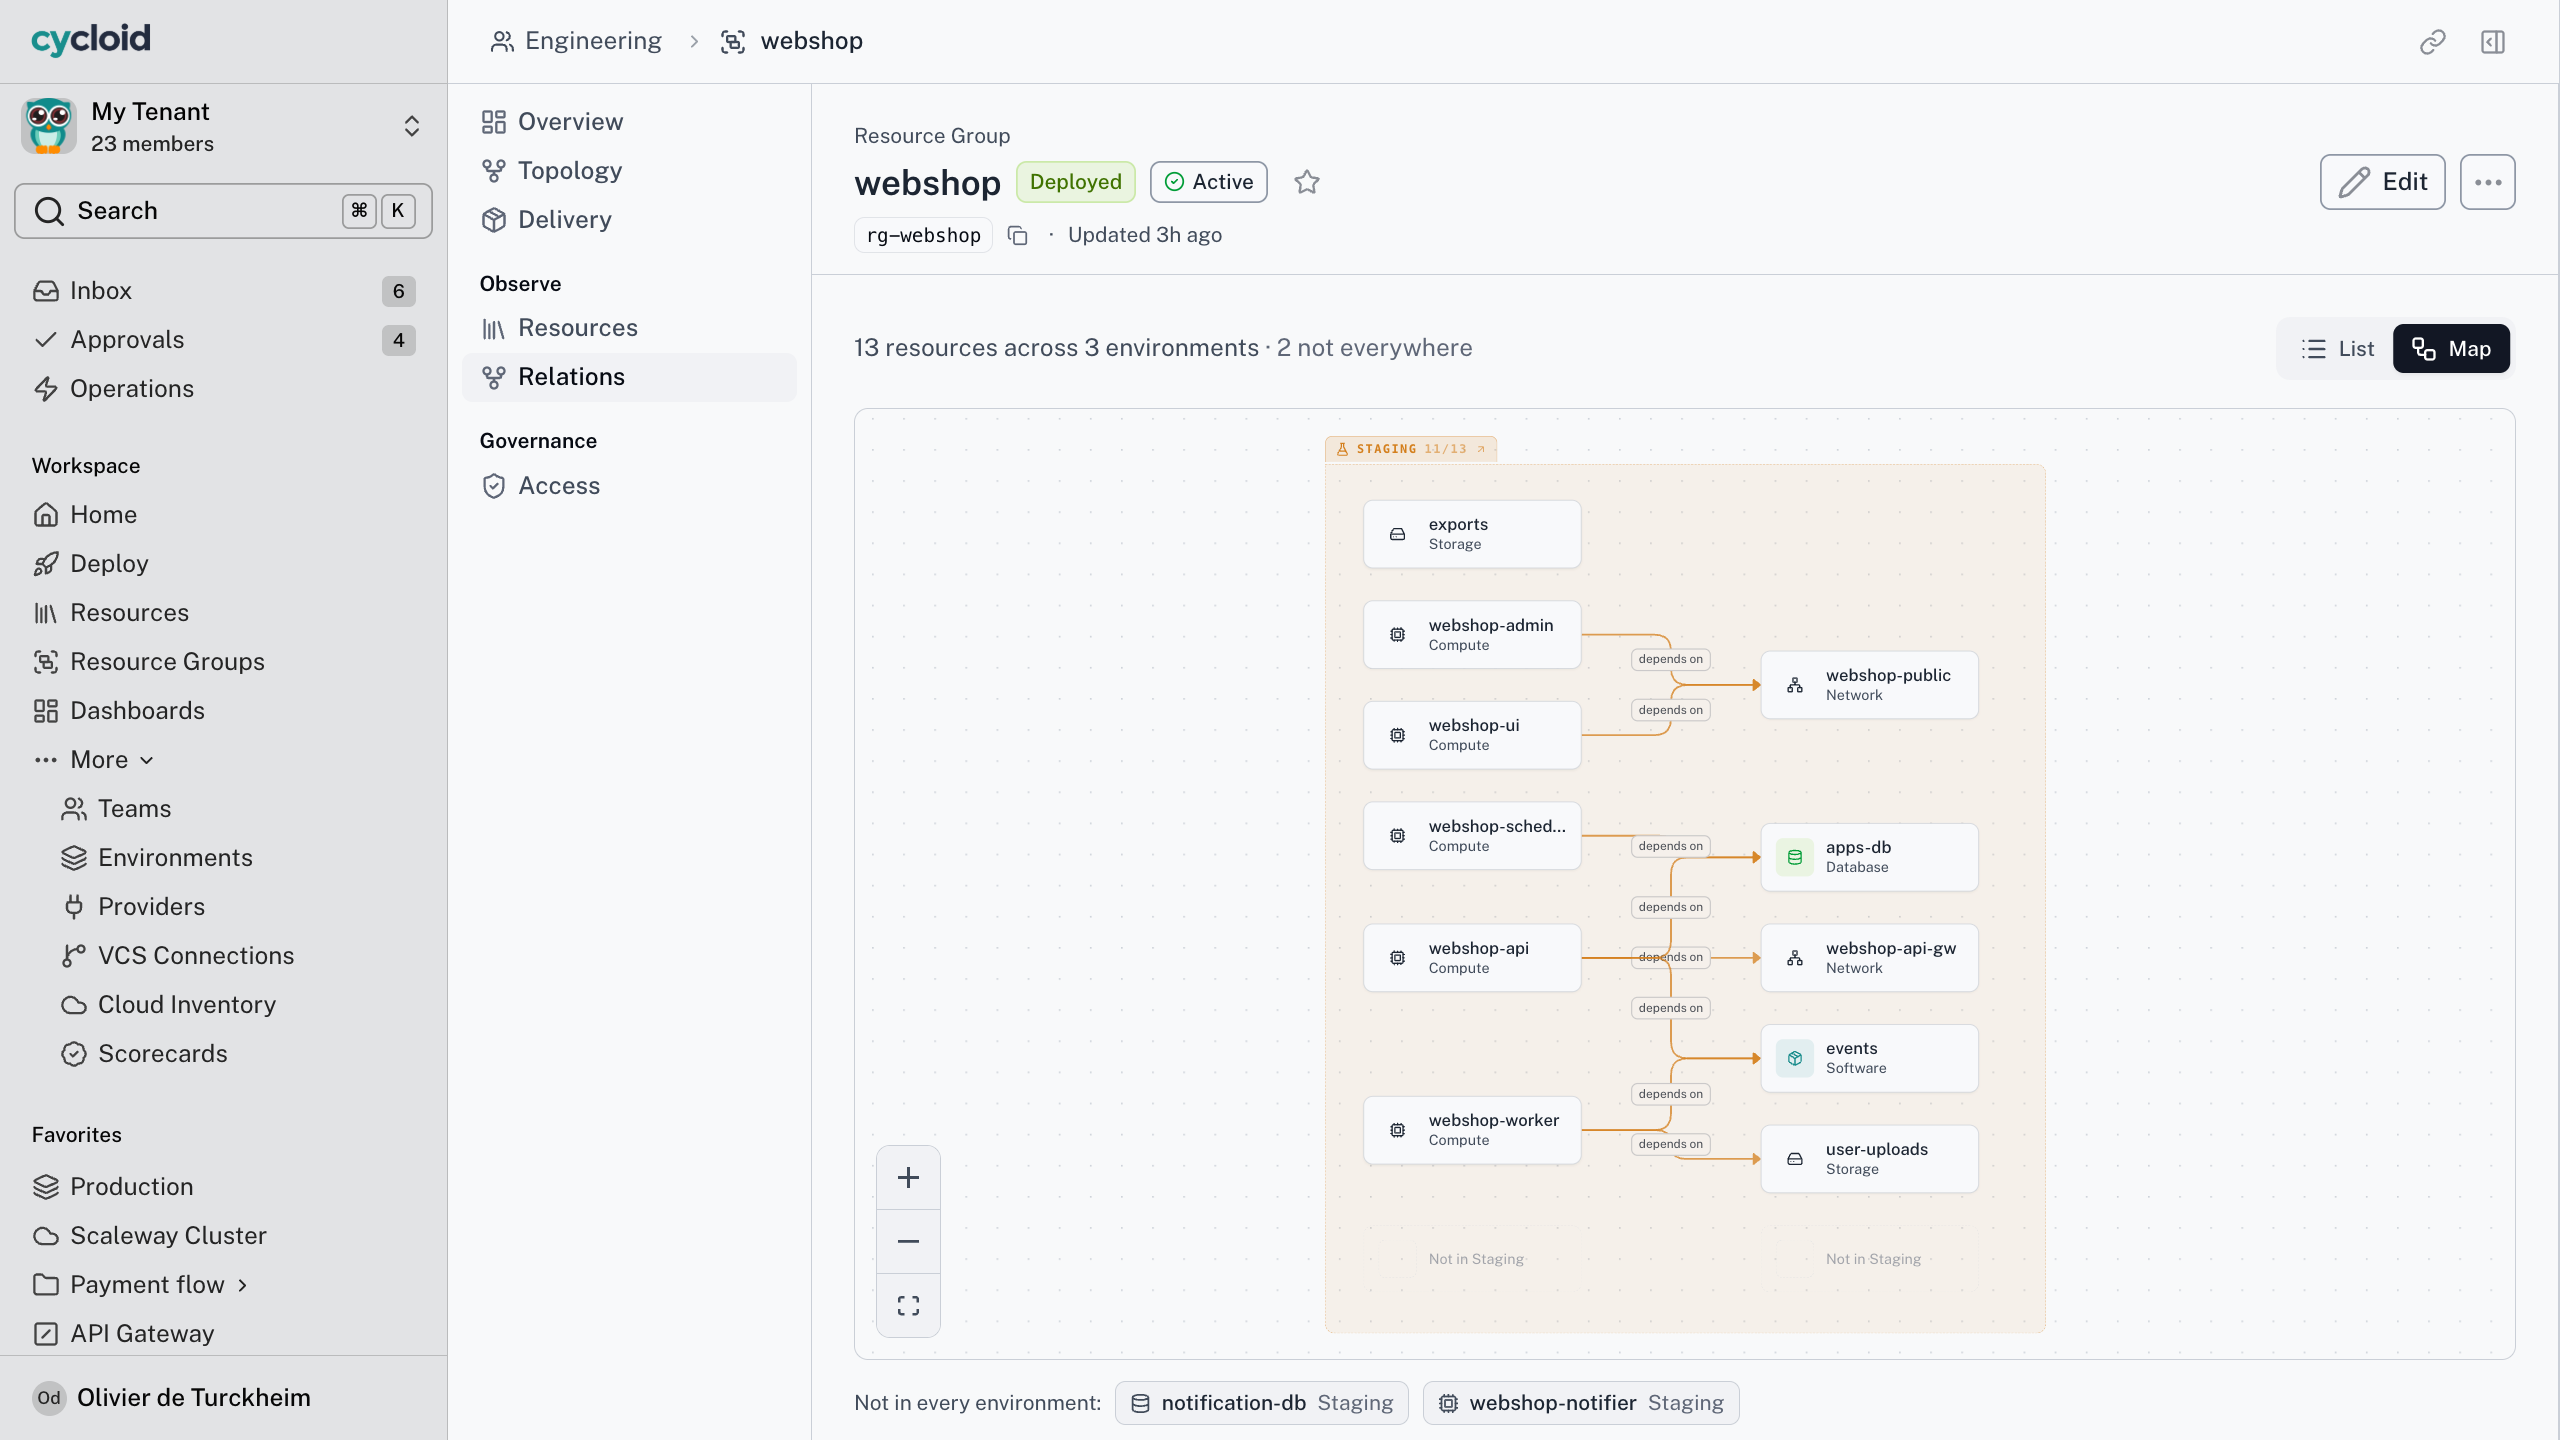
Dependency graph
Shows what depends on what, parent and child included, across services, environments and clouds.
Built from inventory data and linked to the Resources that manage it. No diagram to keep up to date.
Built for
Developers
Platform & DevOps
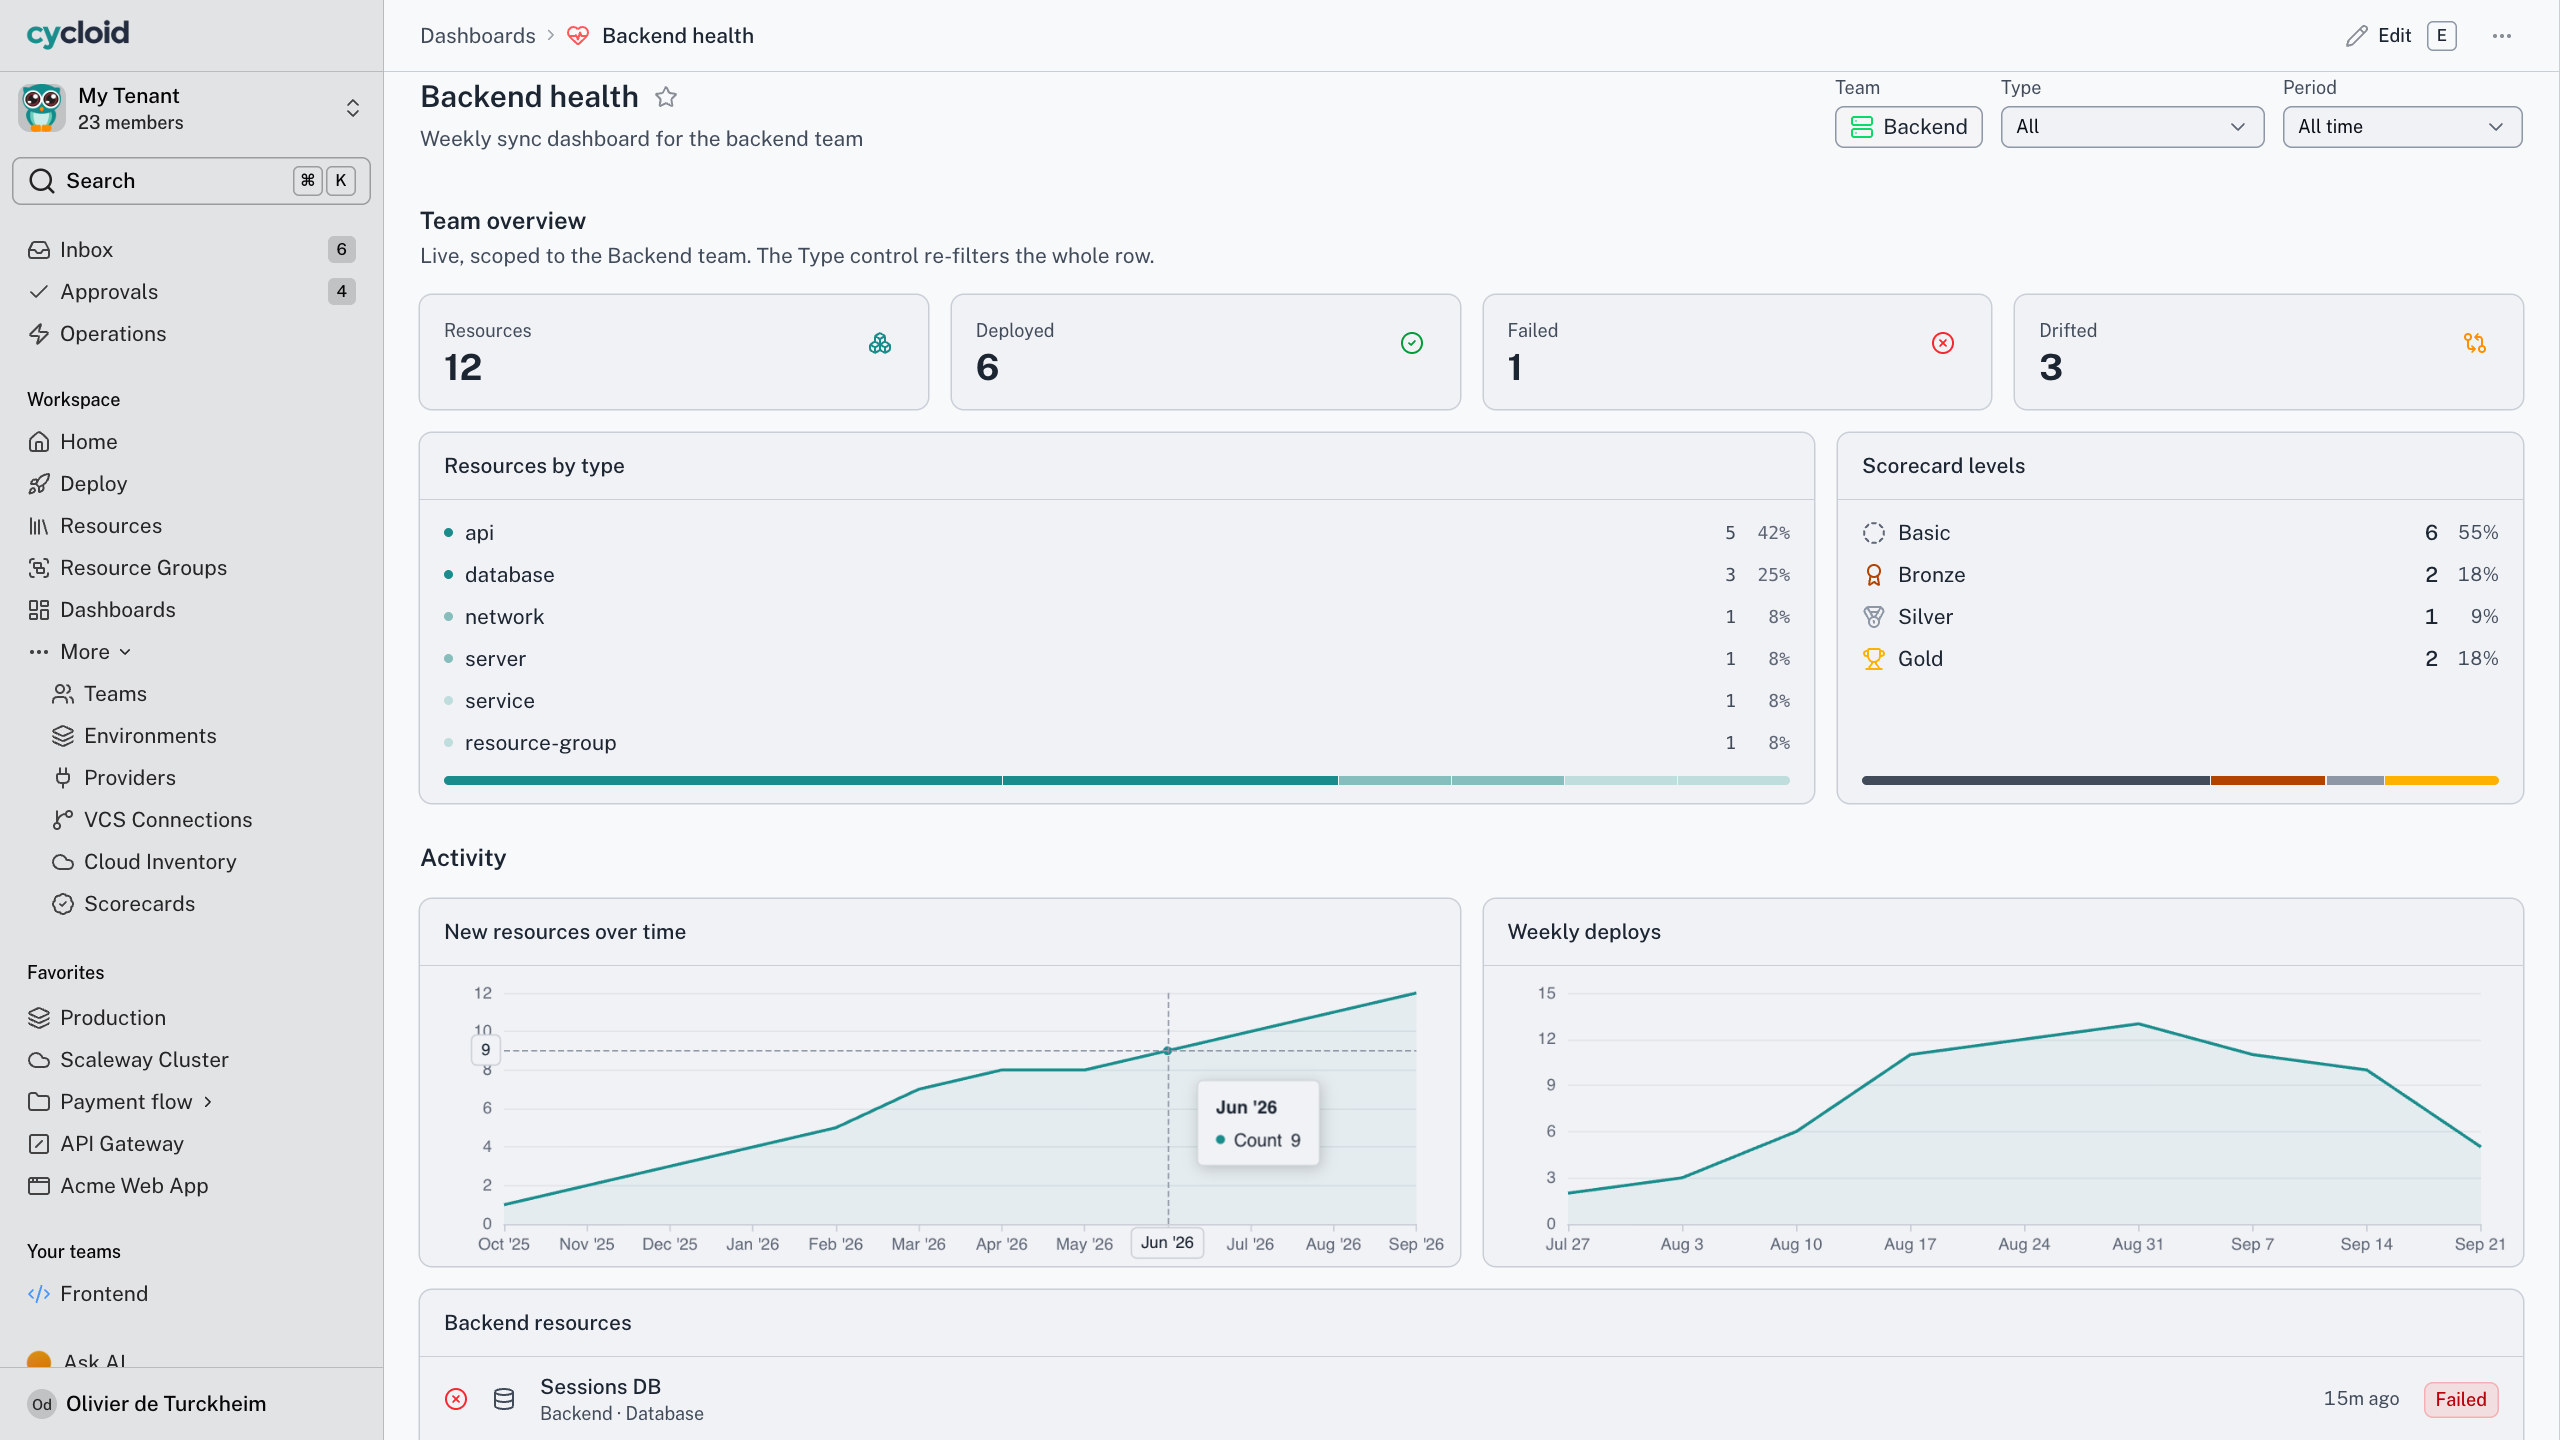
Composable dashboards
Builds dashboards from catalog, inventory, scorecard and operations data, for a tenant, a team or one person.
Drag panels onto a grid, start from 14+ templates, and every panel queries as the viewer.
Built for
Executives
Platform & DevOps
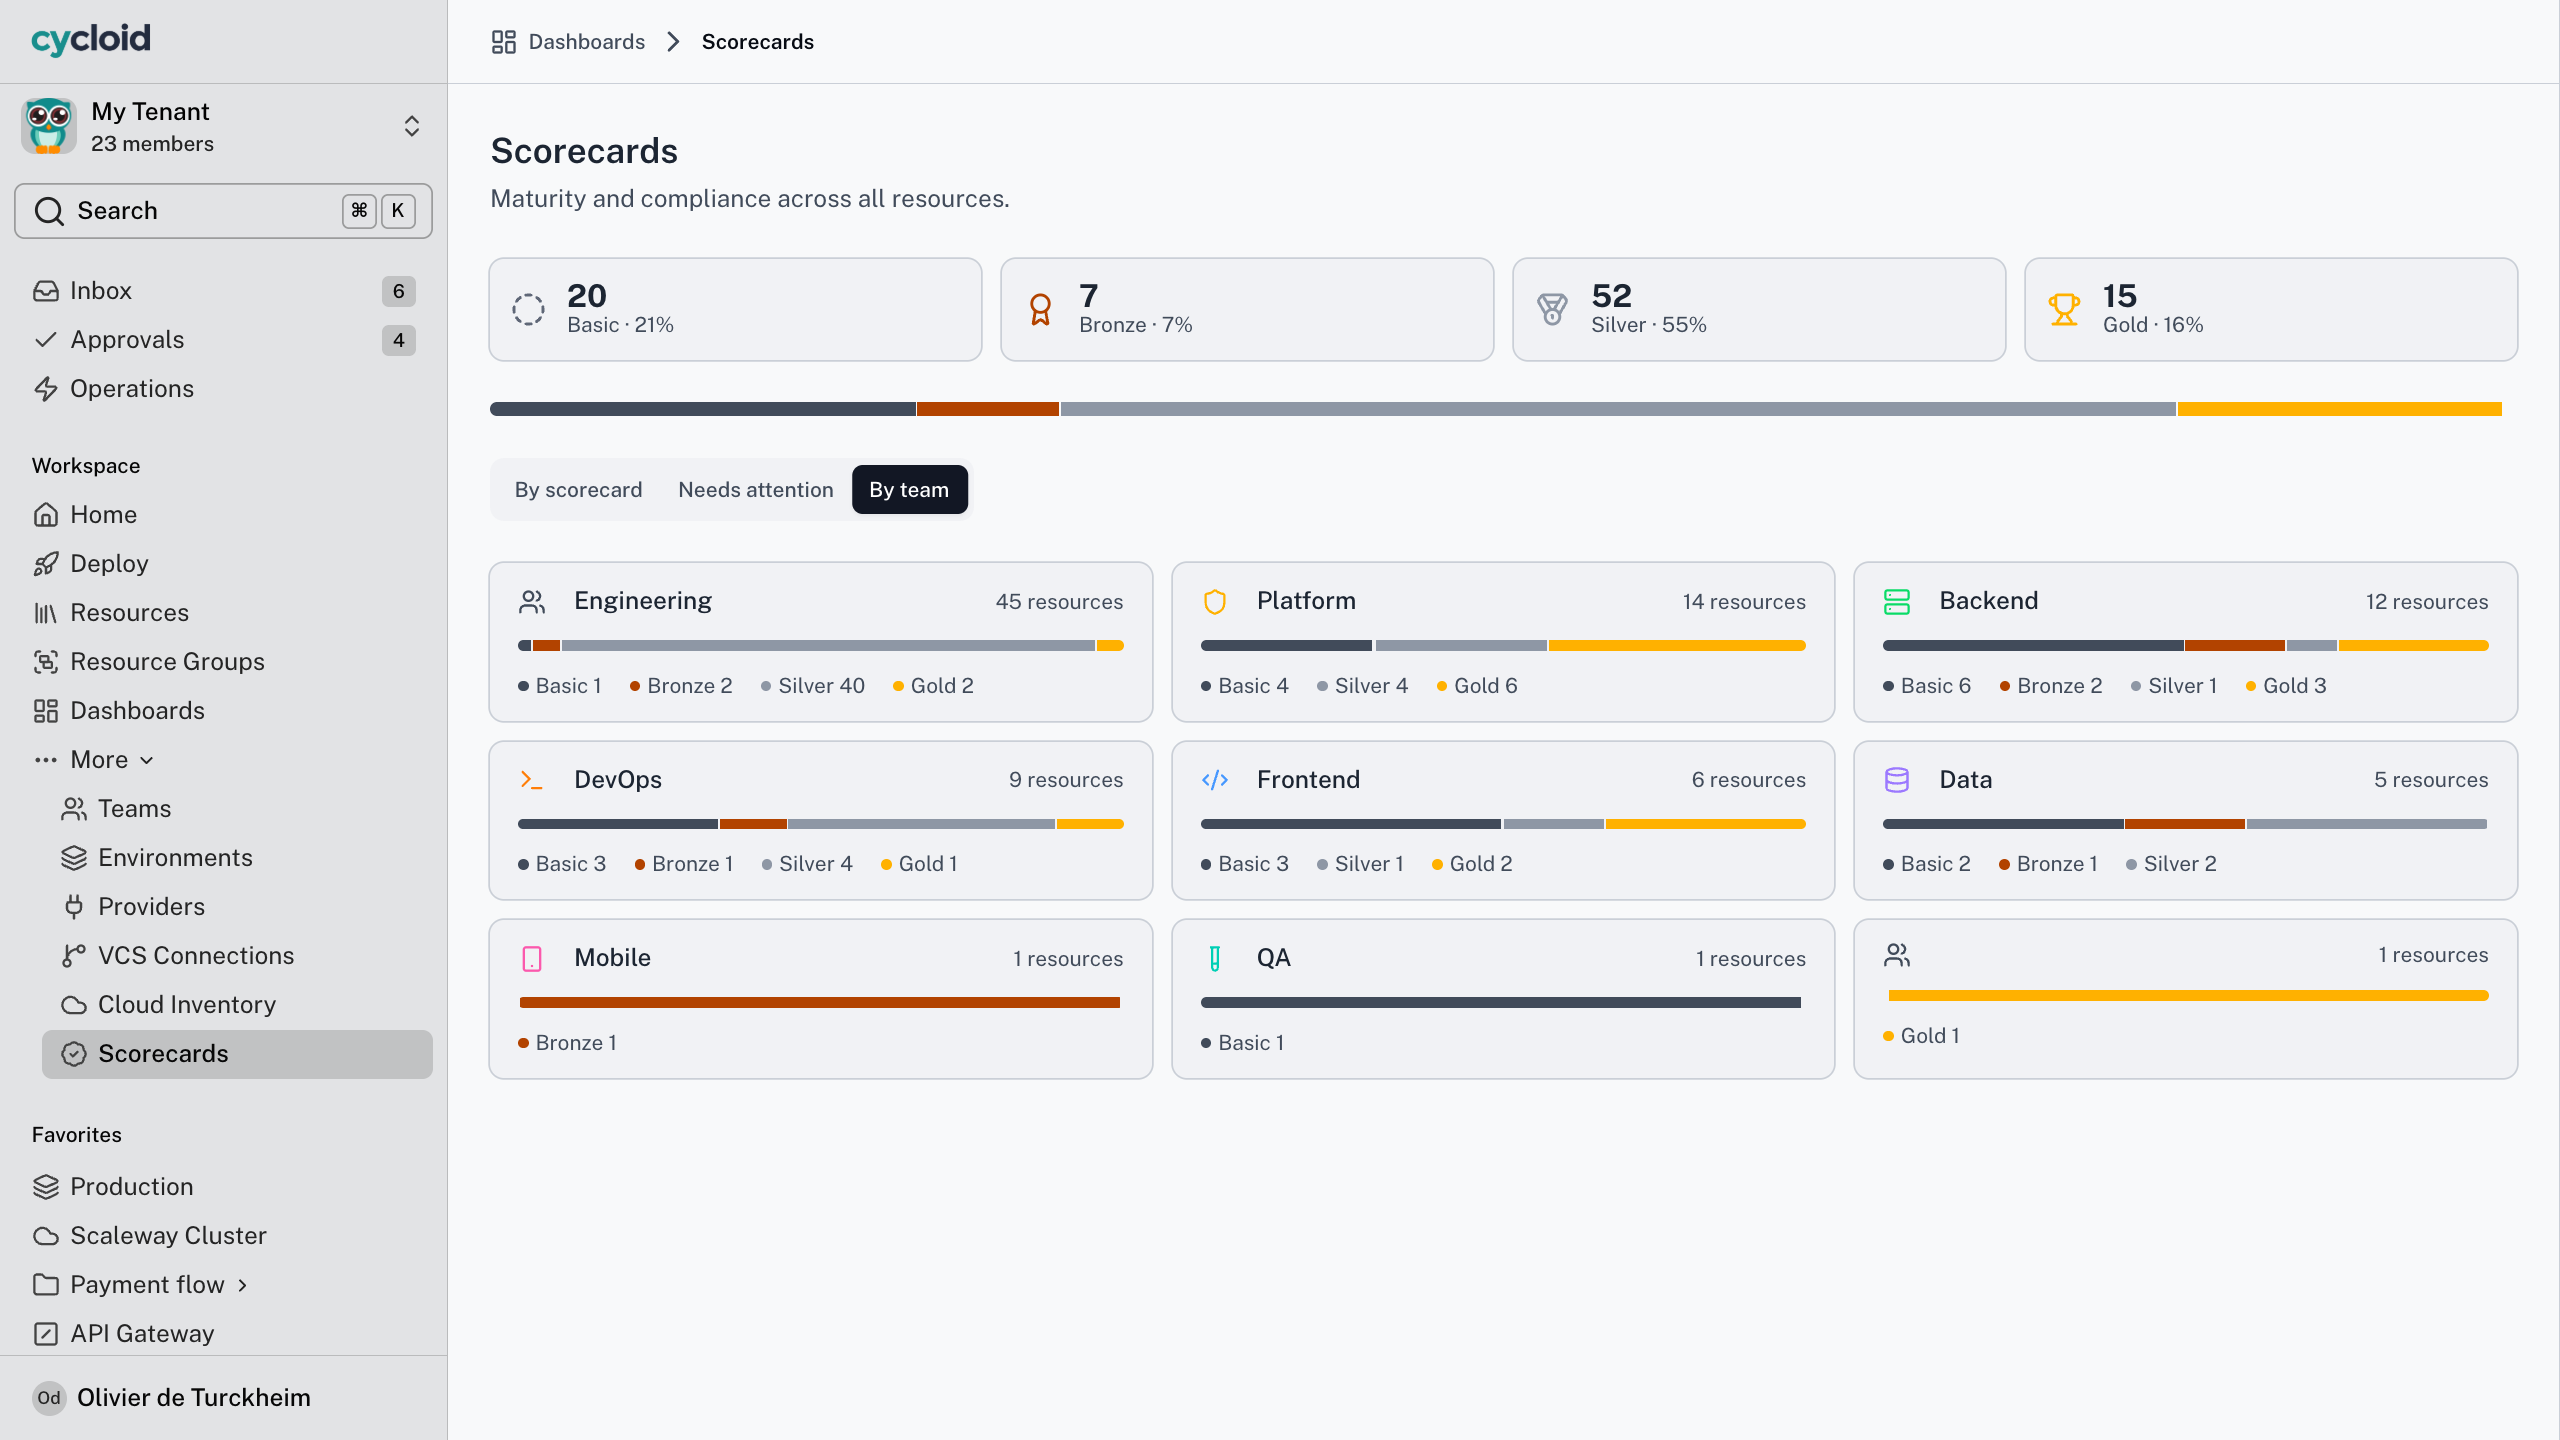
Scorecards
Grades each Resource against your rules on a ladder: Basic, Bronze, Silver, Gold, or your own names.
Stale data never scores as a pass, and DORA metrics come as default templates.
Built for
Platform & DevOps
Executives
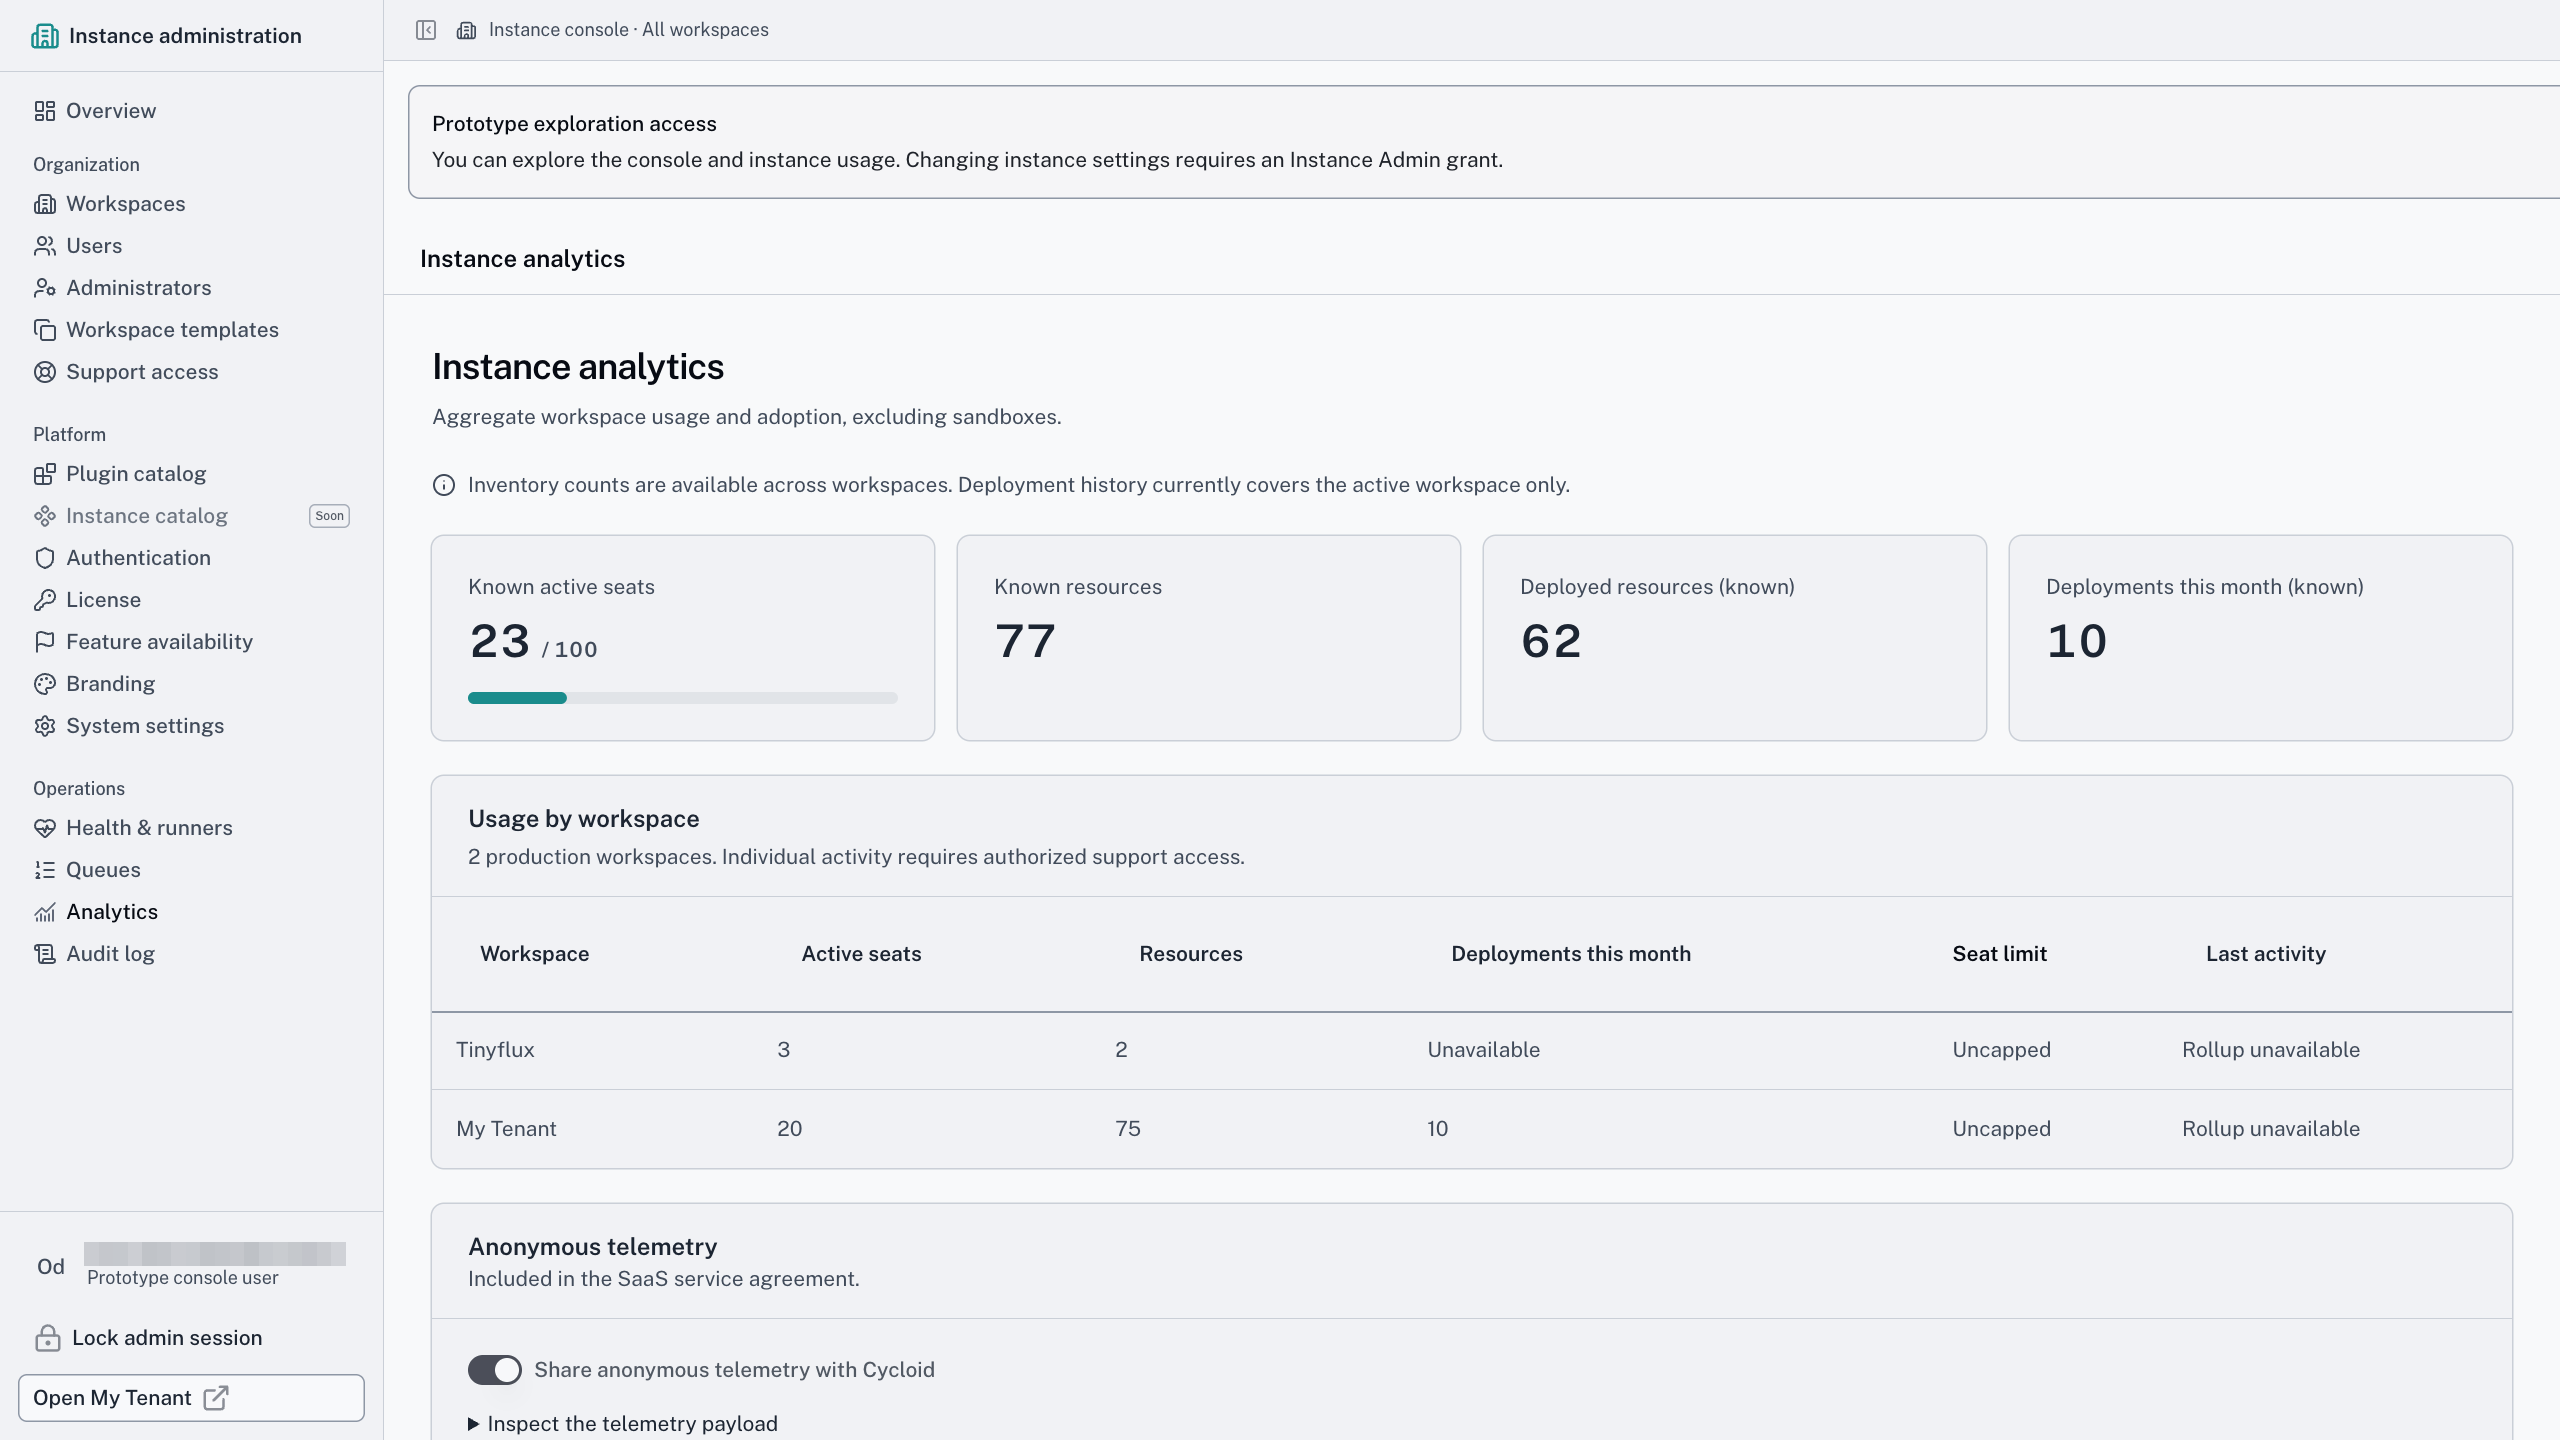
Adoption analytics
Built for
Platform & DevOps
Executives
The whole picture of the Portal & Visibility pillar
One path, and where it leads
Four steps, each with a page of its own. The first two feed the record, the last two read it.
Bring the estate nobody can map
Your messiest cloud account. In twenty minutes we’ll put it on one record you can act on.