INFRAVIEW
Real-Time Infrastructure Visibility for Multi-Cloud Teams
Your infrastructure, visible to the whole team. Real-time visibility of resources, dependencies, and changes across AWS, Azure, GCP, OpenStack, and Flexible Engine, generated automatically from your Terraform source.
INFRASTRUCTURE VISIBILITY
A pillar of platform engineering
It’s important to have good visibility of your cloud services, but keeping cloud diagrams up-to-date takes time. Sharing lines of YAML isn’t an efficient way to share information but then again, Infrastructure as Code is best practice and you know it. Even so, it doesn’t always make as much sense to the rest of your colleagues as it does to you. If you have a truly de-siloized, cross-functional team, you’ll know that some team members aren’t truly able to visualize, nor take advantage of the information your IaC contains.
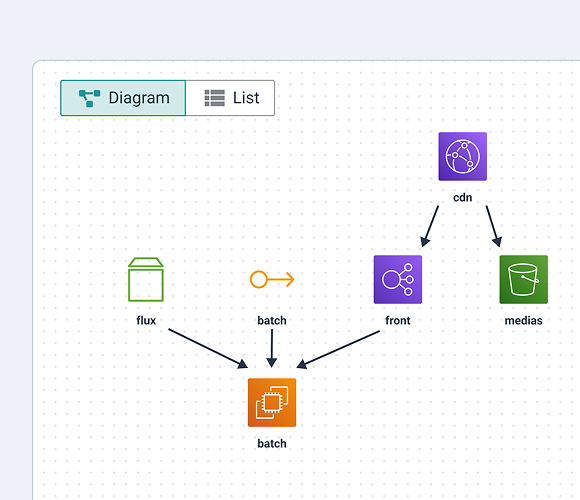
That’s why we made InfraView, a tool that provides a centralized graphical representation of your infrastructure. By showing the information graphically, people without specialized knowledge can see the various resources and how they relate to each other and leading to great infrastructure visibility. When everyone has access to the same information, knowledge-sharing is more fluid and equitable.
Offers visibility of your cloud infrastructure
Keeps infrastructures up-to-date
Allows full visibility of cloud resources
Helps build bridges between teams
Has interactive schema, allowing users to access information such as IP addresses, VM sizes, and more
Effortless up-to-date diagram
Up-to-date diagram based on your Terraform file that you don’t have to maintain, and that you can share with others to accelerate your cloud and DevOps adoption.
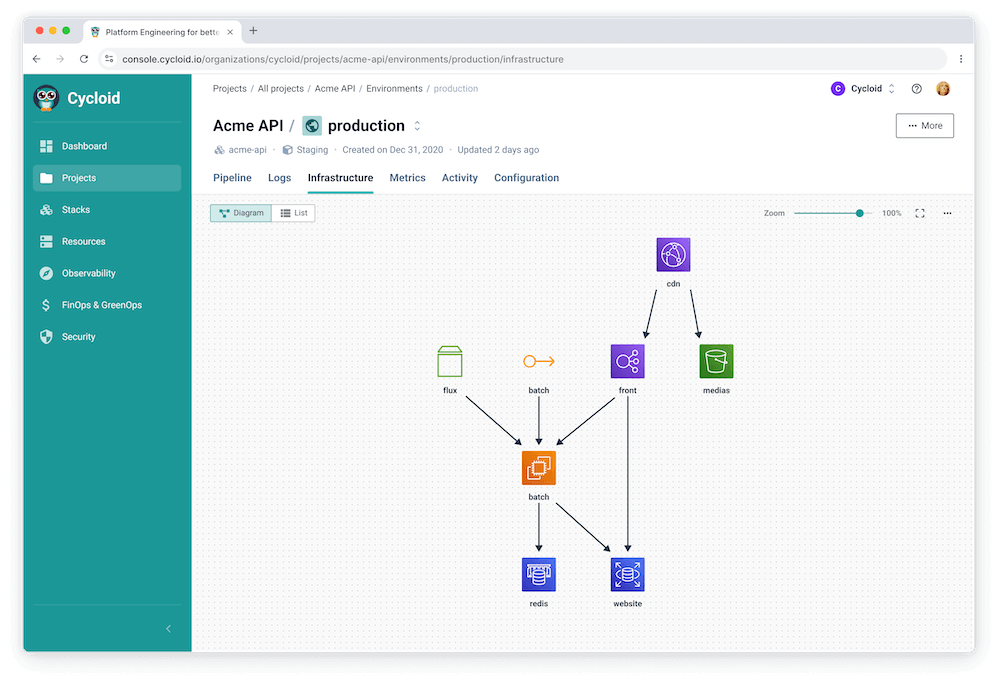
See connections
See connections between resources per environment such as Dev / Staging / Prod.
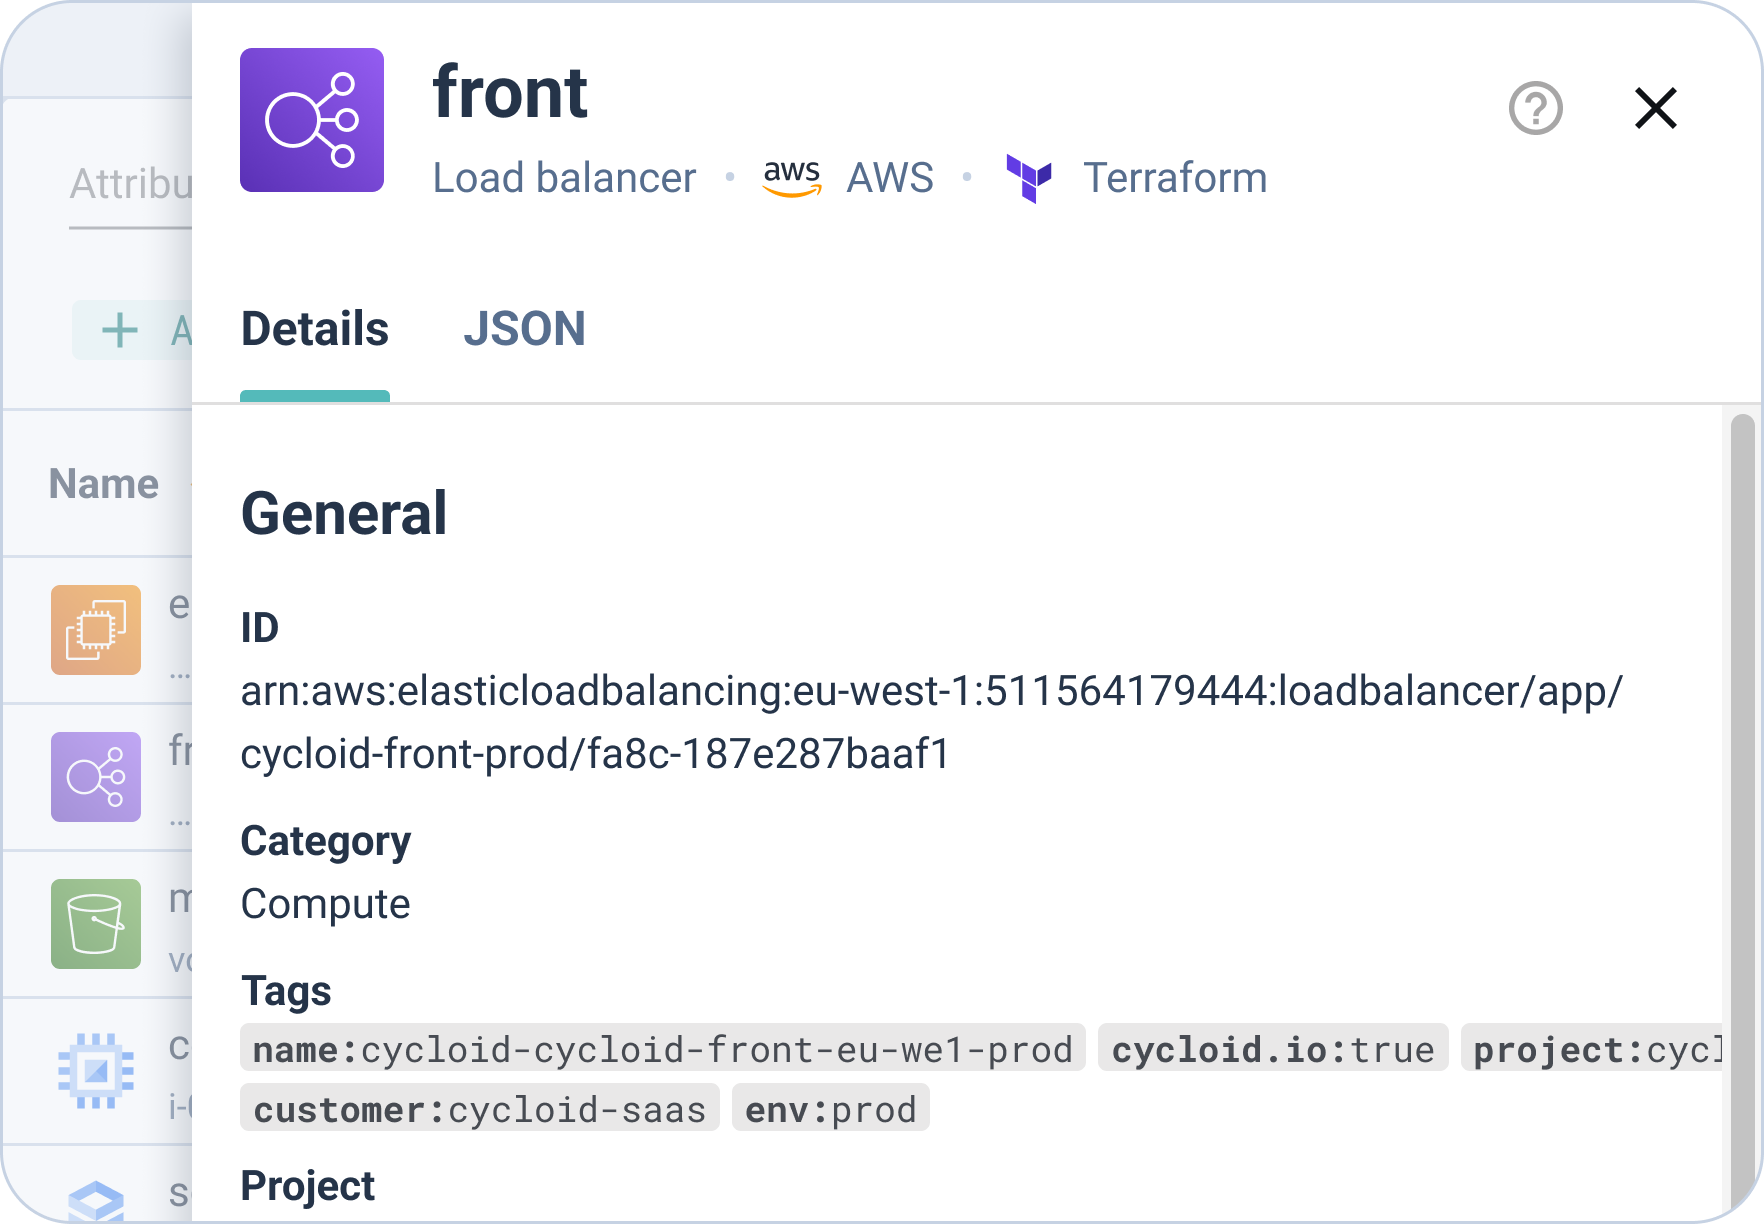
Get visibility
See up-to-date resource information from your cloud infrastructure to spread information across your team.
Supported cloud providers




INFRASTRUCTURE VISIBILITY
What Is Infrastructure Visibility?
It is the ability to see, in real time, the full state of every infrastructure resource across every cloud provider, team, and environment – what exists, where it lives, who owns it, what it costs, and how healthy it is. It is the foundation layer that FinOps reporting, governance policy, incident response, and capacity planning all depend on. Without it, engineering teams discover cost anomalies weeks late, hit outages caused by undocumented drift, and spend platform-team hours reconciling per-provider dashboards.
An infrastructure visibility tool that covers only the first dimension is a dashboard. One that covers all three, tied back to the IaC source of truth, is a governance layer.
Three dimensions define a production-ready infrastructure visibility capability
Resource inventory: Automated discovery of every asset across AWS, Azure, GCP, and any private cloud or on-prem estate. Aggregated in one dashboard rather than reconciled from provider-specific views. See our cloud asset inventory guide for the deeper inventory lens.
Configuration state: Full configuration for each resource (instance type, IAM roles, network settings, encryption status), with change history and drift alerting when live state diverges from the IaC definition.
Cost attribution: Every resource priced against the provider’s rate card, allocated to the correct team, project, and environment. Feeds the FinOps solutions layer from the same source data.
WHY IT MATTERS
Why Infrastructure Visibility Matters for Platform Teams
Three pain points make infrastructure visibility a 2026 priority for platform engineering leaders.
Cost anomalies discovered too late
Flexera’s 2026 State of the Cloud Report put industry-average IaaS and PaaS waste at 29% – the first rise in five years, driven by AI workload sprawl. Real-time visibility catches the anomaly before the invoice arrives.
Drift-driven incidents
When engineers modify live infrastructure outside the IaC pipeline, configuration state and Terraform state diverge. The next incident takes twice as long to diagnose because “the diagram is out of date.”
Multi-cloud reconciliation tax
AWS Cost Explorer sees AWS. Azure Resource Graph sees Azure. A team running workloads on two or three clouds gets two or three dashboards, tagging conventions, and billing periods that do not line up.
Visibility is the foundation. Governance sits on top. See our cloud management platform page for the broader stack context.
CYCLOID INFRAVIEW
What It Does Well
InfraView ships as part of the integrated Cycloid IDP alongside StackForms (self-service provisioning), Stacks (reusable IaC templates), the FinOps dashboard, and Cloud Carbon Footprint.
IaC-driven diagrams
Reads the Terraform source (via the open-source InfraMap engine) and generates the diagram automatically. No manual updating, no drift between the diagram and reality, no “please someone update Lucidchart.”
Real-time resource metadata
Every entity in the diagram is clickable: IP addresses, VM sizes, IAM configuration, dependencies. Developers stop asking; the platform team stops answering.
Cross-team accessibility
The graphical view lets non-IaC engineers (product managers, SREs, security reviewers) see the same infrastructure the platform team sees. Knowledge-sharing becomes structural rather than ad-hoc.
Where InfraView defers: application performance monitoring, distributed tracing, and log aggregation live better in dedicated observability platforms. InfraView is a governance and visibility layer, not an APM tool.
Frequently Asked Questions
What is infrastructure visibility?
Infrastructure visibility is the ability to see, in real time, the full state of all infrastructure resources across every cloud provider, team, and environment – including configuration, cost, ownership, and health status. For multi-cloud platform engineering teams, unified infrastructure visibility eliminates the blind spots that cause cost overruns, configuration drift, and slow incident response. It combines resource inventory, configuration state, and cost attribution into a single system-of-record.
Why is infrastructure visibility important for multi-cloud teams?
Multi-cloud teams typically run workloads across AWS, Azure, and GCP with per-provider dashboards, inconsistent tagging conventions, and no unified real-time view. This blind spot is the root cause of cost anomalies discovered too late, drift-driven incidents, and slow ownership resolution. Infrastructure visibility is the foundation that FinOps, governance, and incident response all depend on – without it, teams operate reactively.
How does InfraView improve infrastructure visibility?
InfraView provides a centralised graphical representation of all cloud infrastructure across AWS, Azure, GCP, OpenStack, and Flexible Engine, generated automatically from the Terraform source so diagrams stay current without manual maintenance. It shows connections between resources per environment (Dev, Staging, Prod), surfaces up-to-date resource metadata (IPs, VM sizes, dependencies), and integrates natively with the Cycloid IDP so cost and provisioning data reference the same source of truth.
What is the difference between infrastructure visibility and infrastructure monitoring?
Infrastructure visibility answers “what exists, who owns it, and what does it cost” – the static and configuration-state view. Infrastructure monitoring answers “is it running, is it slow, is it failing” – the runtime and performance view. Datadog and Dynatrace are monitoring tools; InfraView is a visibility and governance layer. Most enterprises run both: monitoring for runtime, visibility for governance and FinOps.
What tools provide real-time infrastructure visibility across AWS, Azure, and GCP?
Options for real-time multi-cloud infrastructure visibility include Cycloid InfraView (IDP-native, IaC-driven, integrated with cost management), Datadog Cloud SIEM and Cloud Cost Management (observability-first, add-on cost), Dynatrace (application monitoring with infrastructure context), and native cloud tools (AWS Config, Azure Resource Graph) which are single-provider. IDP-native visibility differs from standalone observability by tying the view to the IaC source of truth and integrating provisioning and FinOps into the same platform.